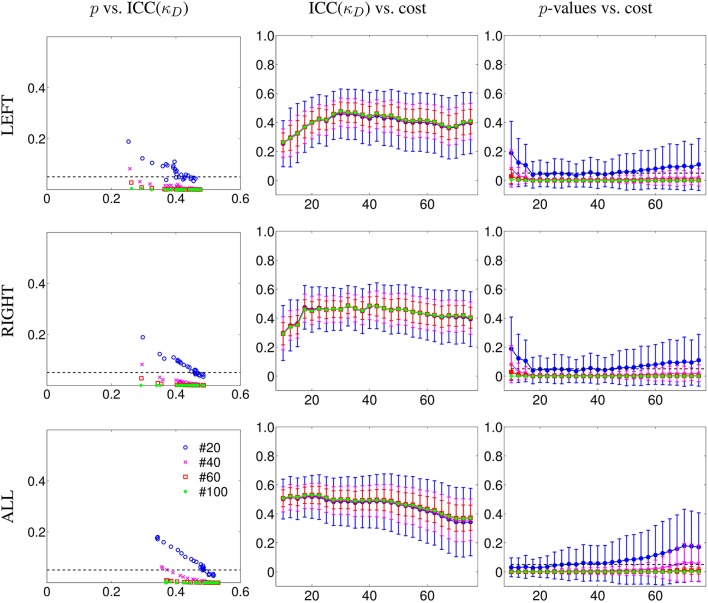
Figure 2.
Reliability results for κ degree (κD) in terms of number of subjects as a function of the cost from 10 to 75%, in steps of 2.5%. Results are given for subgroups of 20, 40, 60, and finally, 100 subjects using the database of the HCP project. First column, p-values of ICC (y-axis) as a function of ICC values (x-axis) for different number of subjects. Second column, values of ICC (y-axis) as a function of the cost (x-axis) for different number of subjects. Third column, ICC associated p-values (y-axis) as a function of the cost (x-axis) for different number of subjects. LEFT refers to the graph built from the left intra-hemispheric connections, RIGHT for the right intra-hemispheric connections. ALL refers to the graph built from connections of the whole brain. In addition, we found that κD is more reliable than classical metrics. We observed similar behaviors with other metrics (compare Figure S1 and Figure S2 in Supplementary Material).

