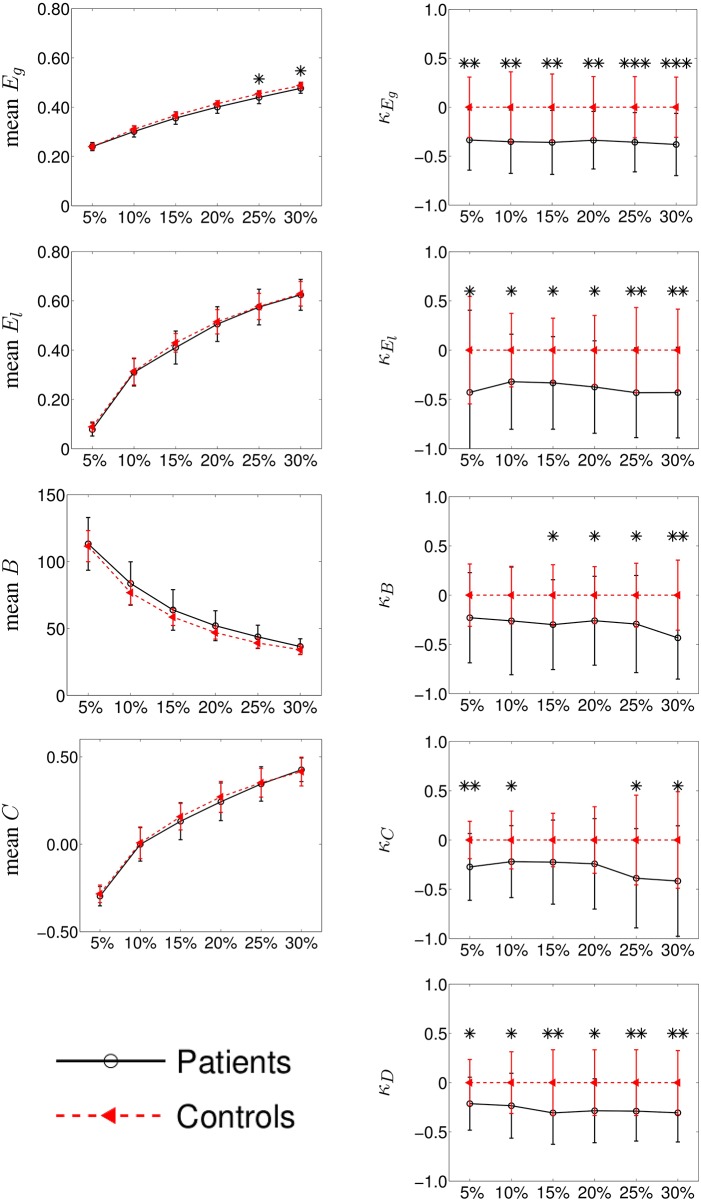
Figure 3.
Group differences between mean intra-hemispheric connectivity in controls and contralesional hemispheric connectivity in stroke patients according to classical graph metrics (left column) and κ index (right column). Metrics (y-axis) correspond to global efficiency (mean Eg and κEg, respectively), local efficiency (El and κEl), betweenness centrality (B and κB), clustering coefficient (C, and κC) and node degree (κD). Cost (x-axis) ranges from 5 to 30%. Error bars indicate standard deviation and significant differences (Wilcoxon, p < 0.05) are indicated with asterisk (*) (* < 0.05; ** < 0.01; *** < 0.001). Using κ, we found huge significant differences between the two groups while with classical graph metrics, differences were difficult to observe.

