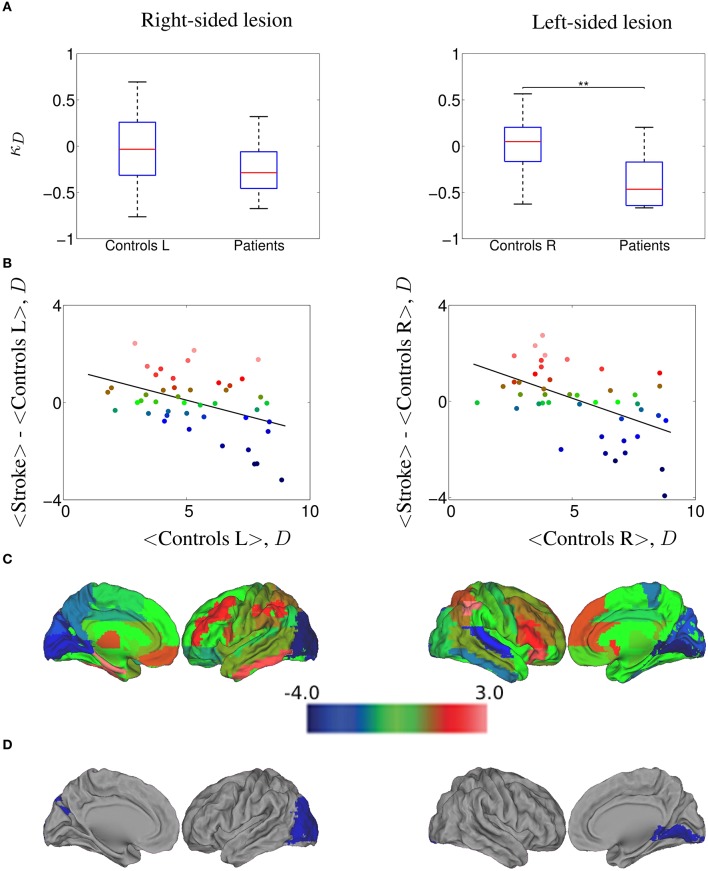
Figure 4.
κD hub disruption of functional networks in stroke patients contralesional hemisphere, computed at a 20.0% cost. (A) Boxplots of the individually estimated hub disruption indices for the healthy volunteer group and the stroke patient group. On the left, healthy volunteer group left hemisphere and stroke contralesional left hemisphere; on the right, healthy volunteer group right hemisphere and stroke contralesional right hemisphere. Significant differences (Wilcoxon, p < 0.05) are indicated with asterisk (*) (* < 0.05; ** < 0.01; *** < 0.001). (B) On the left, results of the healthy volunteer group left hemisphere and the stroke group with left contralesional hemisphere, where κ = −0.27; on the right, results of the healthy volunteer group right hemisphere and the stroke group with right contralesional hemisphere, where κ = −0.36. (C) Cortical surface representation of the difference in mean D between both groups; red denotes increased D, on average, in patients compared with healthy volunteers; blue denotes abnormally decreased D in stroke patients. (D) nodes that demonstrated significant between-group difference in nodal D; Wilcoxon test, p < 0.023; red denotes significantly increased D and blue denotes significantly decreased D in the patients on average.

