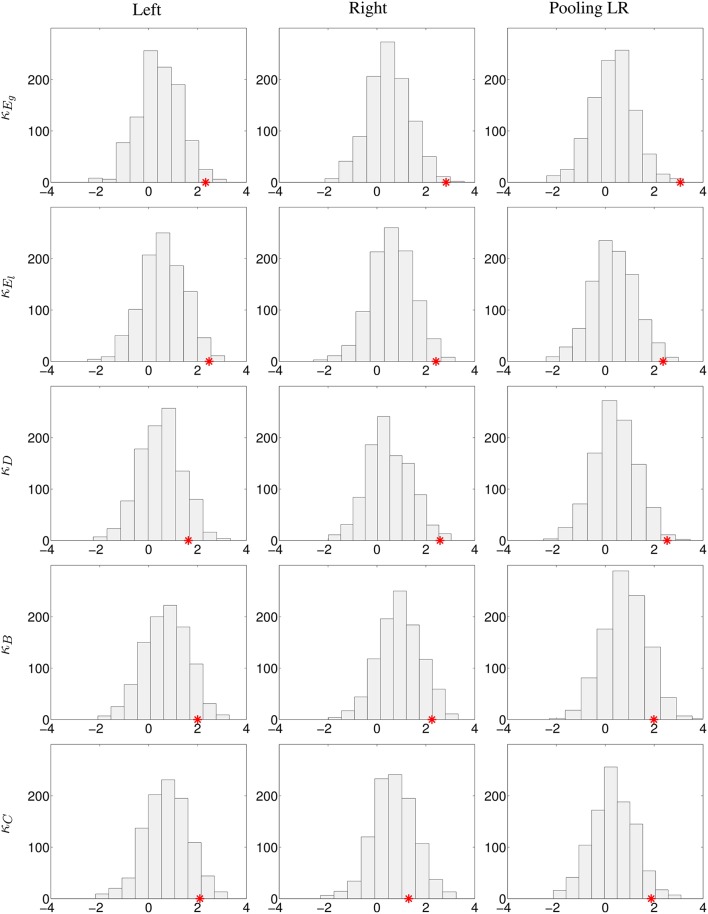
Figure 5.
Analysis of the robustness of the significant differences between controls and stroke patients using the HCP database. 1000 bootstrap sampling iterations were performed. In each iteration, 40 subjects were randomly selected (20 subjects as healthy controls, 11 subjects as left-sided lesion patients, and 9 subjects as right-sided lesion patients), their respective κ index and the z-values (Wilcoxon test) of the comparison of κ between the control and patient groups for each graph metric were computed. Histograms with the bootstrap sampling of κEg, κEl, κD, κB, and κC at 20% cost are shown. First column, replication of left lesioned stroke; middle column, of right-sided lesion stroke; last column, pooling left and right-sided lesion groups, and compared against the mean between left and right hemispheres in controls. The red star corresponds to the true z-value obtained from the comparison of κ between patients and controls.

