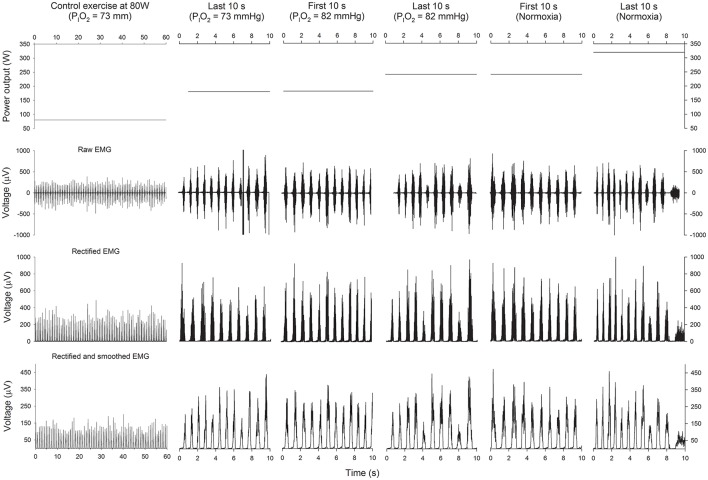
Figure 2.
Power output and EMG. Schematic representation of the power output (upper panels), raw EMG (2nd row), rectified EMG (3th row), and rectified and smoothed EMG (lower panels), during the last 60 s of the control submaximal exercise at 80 W in hypoxia (PIO2 = 73 mmHg), the last 10 s of the incremental exercise (IE) in severe hypoxia (PIO2 = 73 mmHg), the first 10 s of the transition from a PIO2 of 73 to 82 mmHg, the last 10 s of the IE at a PIO2 of 82 mmHg, the first 10 s in normoxia and the last 10 s before task failure in normoxia.

