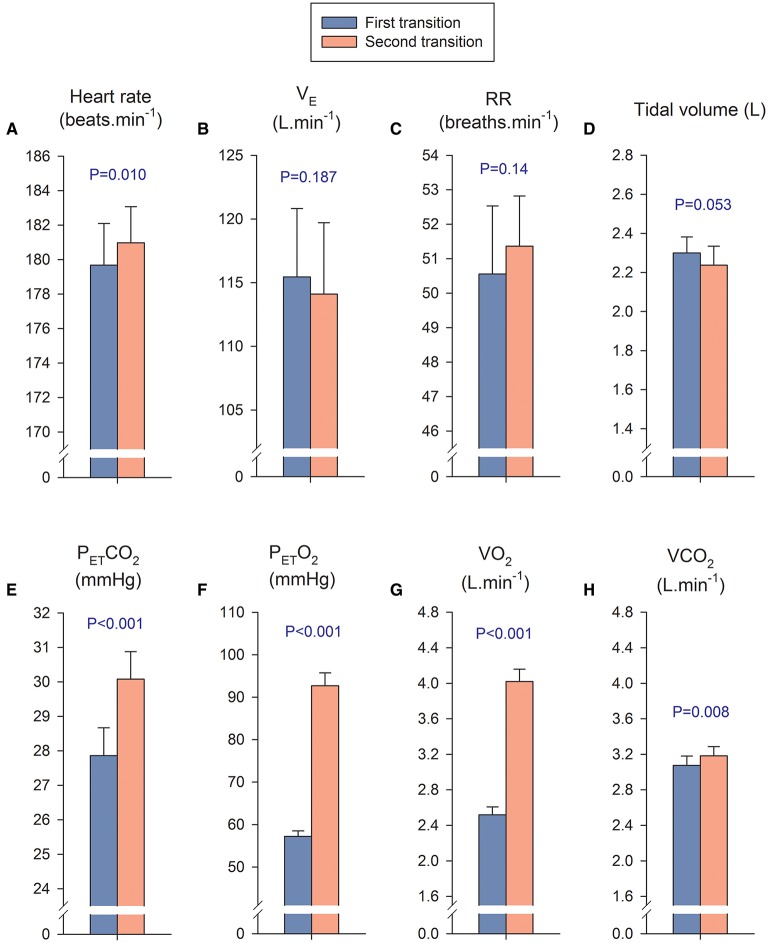
Figure 4.
Cardiorespiratory variables during the first and second transition. In the first transition, the PIO2 was increased from severe hypoxia (PIO2 = 73 mmHg) to less hypoxic levels, while during the second transition the PIO2 was increased from different levels of hypoxia to normoxia. We calculated a mean value for the four PIO2 conditions of the first transition (blue bars) and compared it with the mean value of the four conditions of the second transition (orange bars), including in the analysis only the breath-by-breath data collected during the first 10 s of each transition. The mean response of the first transition was compared with the mean response of the second transition with a Student's paired t- test. It is important to remark that in both transitions the absolute exercise intensity was similar (170–173 W), however there is a remarkable difference in VO2 which is explained by the massive passage of O2 from the alveoli to the lung capillaries, driven by the much higher PETO2 during the second transition. This massive diffusion of O2 is facilitated by the low SaO2 of the hemoglobin arriving to the lung capillaries at maximal exercise in hypoxia (Calbet et al., 2016). (A) Heart rate; (B) B pulmonary ventilation (VE); (C) respiratory rate (RR); (D) tidal volumen; (E) end-tidal CO2 pressure (PETCO2); (F) end-tidal O2 pressure; (PETO2), (G) Oxygen uptake (VO2); (H) CO2 production (VCO2). Each bar corresponds to the mean of 10 subjects; error bars represent the standard error of the mean.

