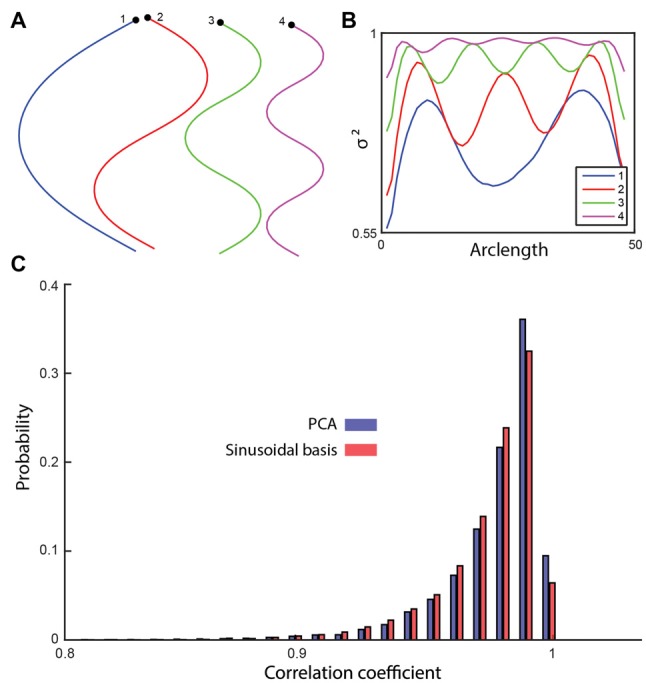
Figure 5.

(A) A cosine series was used to generate four basis shapes with increasing frequency. The corresponding x-y representations are shown. (B) The fraction of the variance explained along the worm by including an increasing number of basis shapes. (C) The shapes in the testing set were reconstructed using the four sinusoidal basis shapes and the top four modes of PCA. The histogram of the correlation coefficients (between the reconstructed and the original shapes) suggests a significant, but small difference between the sinusoidal analysis (96.9%) and the data-driven approach (97.1%; t-test, p = 2.49 × 10⁻¹¹).
