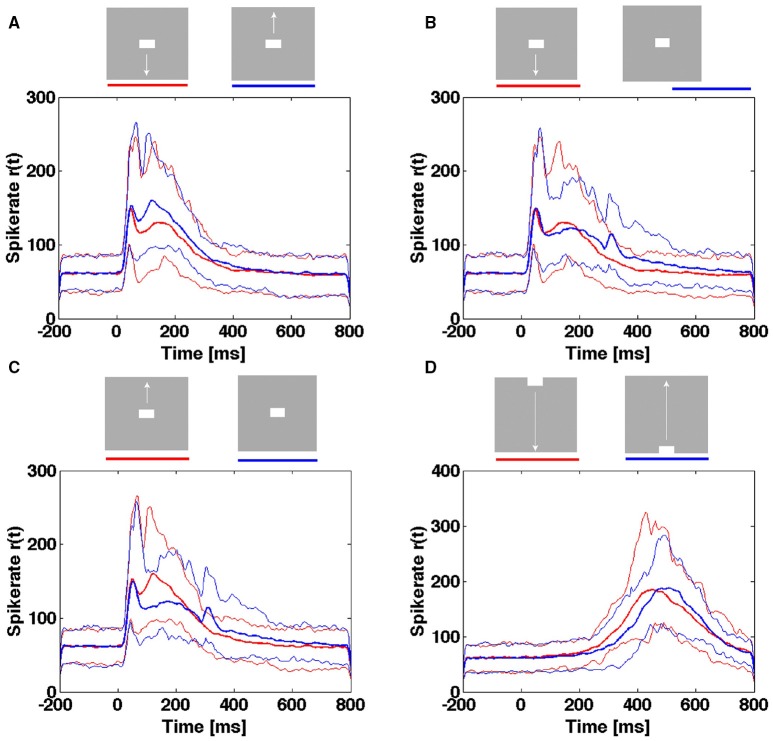
Figure 11.
Spiking rates do not distinguish stimulus conditions in single trials. Multi-unit rates as function of times for 850 trials of the population mapping the CFOV. Mean: thick curves, 10%- ile and 90-%ile: thin curves. (A) Spike rates in Hz from trials with bar moving down (red curves) from CFOV vs. spike rates from trials with bar moving up (blue curves) from CFOV. (B) Spike rates from trials with bar moving down (red curves) from CFOV vs. spike rates from trials with stationary bar (blue curves) flashed in CFOV. (C) Spike rates from trials with bar moving up (red curves) from CFOV vs. spike rates from trials with stationary bar (blue curves). (D) Spike rates from trials with bar moving down (red curves) vs. bar moving up from peripheral FOV (blue curves).

