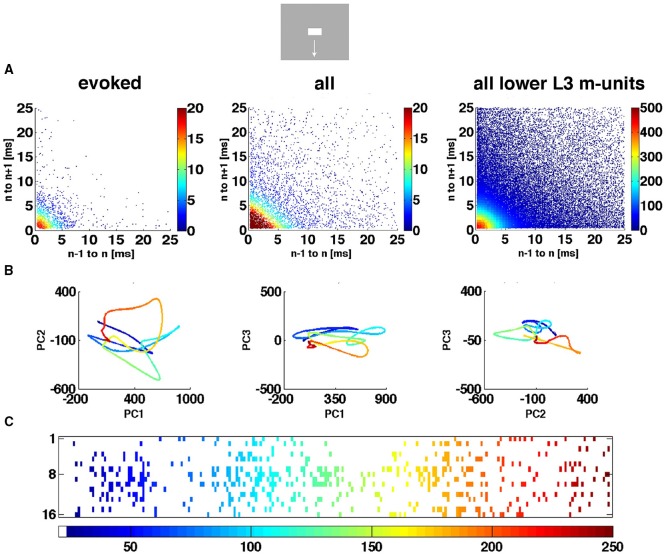
Figure 4.
The spiking dynamics reflect the collective spiking in all cortical layers. (A) Plot of inter-spike intervals of lower layer 3 multi-units located in the CFOV mapping zone. Left: inter-spike intervals (n = 1263), from evoked trials only, in ms from a single electrode penetration in response to a bar moving down from the CFOV. Middle: same electrode penetration inter-trial intervals (n = 5207) for all trials for the bar moving down from the CFOV. Right: inter-spike intervals (n = 30.774) for all lower layer 3 leads in the cortex mapping the CFOV. Note the absence of any periodicity. The color scales show the number of observations within 0.5 × 0.5 ms space. (B) Trajectory of a single trial (trial 30), from 0 to 250 ms in 3 different projections of state space generated by PCA color coded in time after stimulus to compare with (C). First 3 components accounted for 77% of total variance. (C) Same trial as (B), all spikes from all leads. All figures, except (B) left from animal 6, electrode penetration 2.

