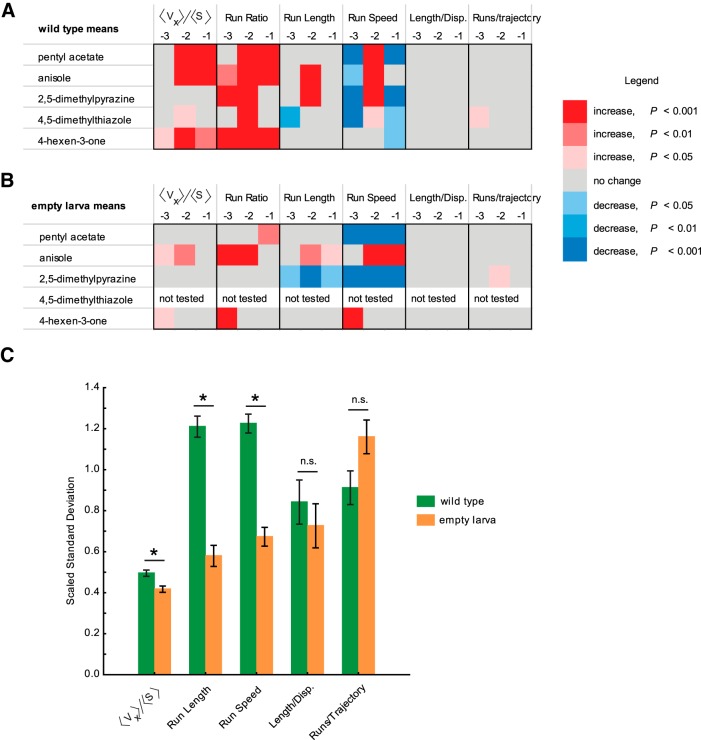
Fig. 6.
Comparisons of strength and variability of behavior responses among wild-type and empty larva genotypes. A, B, Heat map comparisons of statistical difference between the means of navigational parameters in response to odorants and in response to control diluent in wild-type larvae (A) and empty larvae (B). Six navigational parameters at three different dilutions (10−1, 10−2, and 10−3) of each odorant were analyzed. Five odorants were analyzed for wild-type larvae, and four odorants were analyzed for the three empty larvae genotypes. An arbitrary color code was assigned to visualize the statistical difference: red indicates an increase from control levels; and blue indicates a decrease from control levels. Lighter to darker shades of each color are based on an increasing level of significance. For all navigational parameters except run ratio, statistical significance was determined using one-way ANOVA followed by a Tukey’s post hoc HSD test. For run ratio, statistical significance was calculated with a χ2 test followed by a Bonferroni correction. C, Mean SDs for five different behavioral parameters compared for wild-type larvae (green) and empty larvae (orange). Behavior values elicited by four odorants were used for this analysis. Each bar represents the scaled mean ± SEM. Wild-type larvae show higher variance in three of the five behavioral measures compared with empty larvae (Student’s t test followed by Bonferroni correction, p < 0.01).

