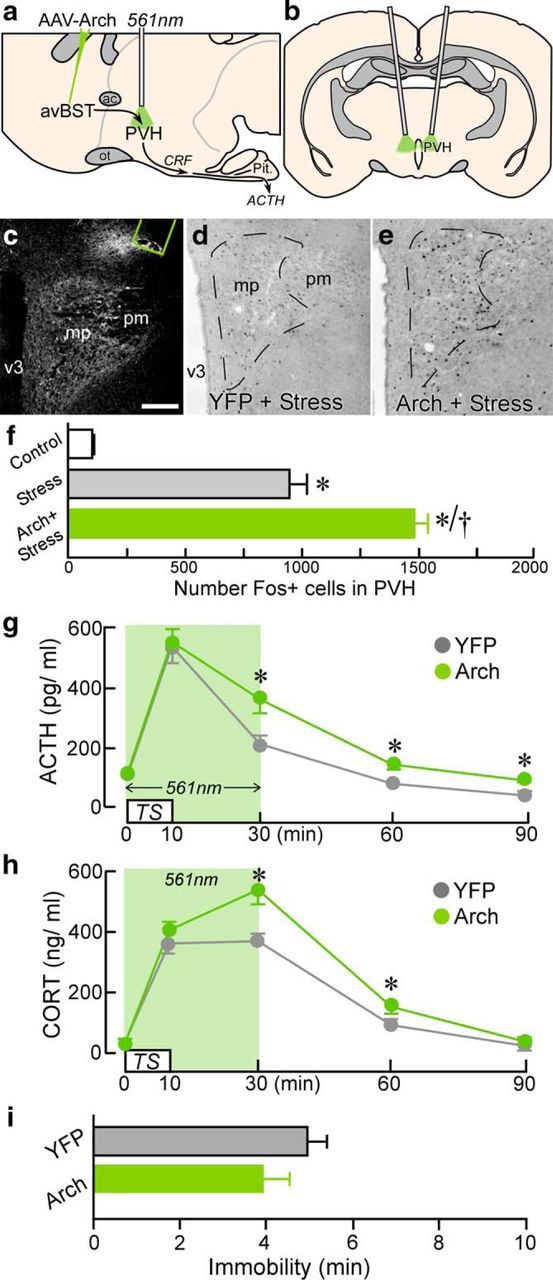
Figure 7.

Selective consequences of avBST-to-PVH pathway photoinhibition on HPA output. a, b, Sagittal schematic diagram depicting AAV-Arch microinjection into avBST (a) and bilateral fiber optic probe implantation dorsal to avBST terminal fields in PVH (right, coronal view; b). c, Dark-field photomicrograph depicting fiber-optic termination (green outline) above YFP-fluorescent avBST terminals in the medial parvicellular (mp) and posterior magnocellular (pm) PVH. d, e, Photomicrographs showing immunoperoxidase labeling of Fos in PVH from a YFP rat subjected to TS and the marked increase in immunoreactivity after avBST terminal photoinhibition. Scale bar, 200 μm (c–e). f, Quantification of Fos-immunoreactive nuclei reveals a significant induction as a result of stress exposure (*p < 0.05) and further enhancement after photoinhibition of avBST neuron axons (†p < 0.05). n = 2 YFP + control, n = 5 YFP + stress, n = 5 Arch + stress. g, ACTH levels in YFP and Arch groups before and after 10 min TS coincident and followed by 561 nm illumination of avBST terminals in PVH, with significant elevations observed 30, 60, and 90 min after stress onset (*p < 0.05). h, CORT levels from the same groups in e showing significant elevations at 30 and 60 min in the Arch group versus YFP controls (*p < 0.05). i, Immobility during TS was not significantly different between groups (p = 0.2). n = 9 YFP, n = 7 Arch (f–i).
