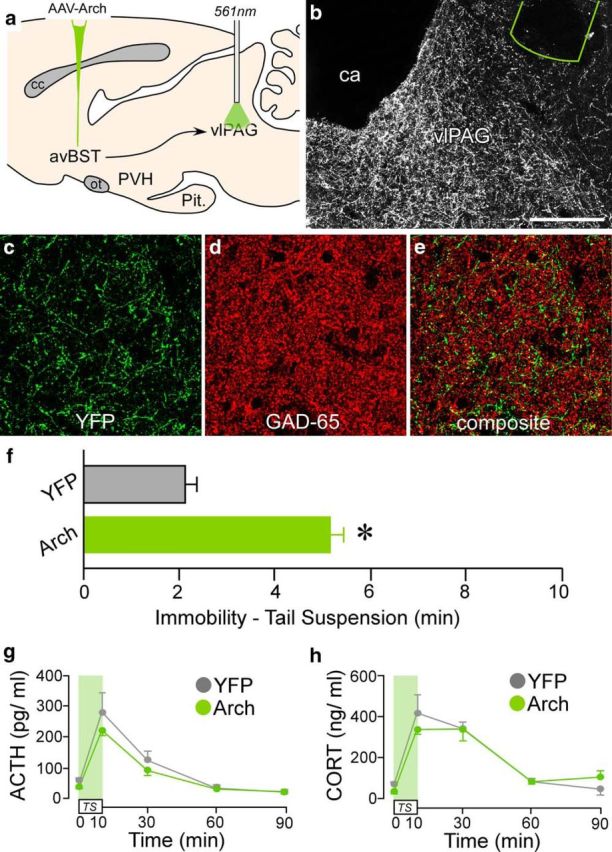
Figure 8.

Selective behavioral consequences after avBST-to-vlPAG pathway photoinhibition. a, Schematic diagram depicting AAV-Arch microinjection into avBST and fiber-optic probe placement above its terminal fields in the ventrolateral periaqueductal gray (vlPAG). b, Dark-field photomicrograph showing fiber-optic probe (green outline) placement above a YFP-fluorescent terminal plexus originating from avBST. ca, Cerebral aqueduct. c–e, Digital reconstructions of YFP-fluorescent axonal and terminal fields in vlPAG (green, c) and colocalization with GAD-65 immunofluorescent terminals (red, d; overlap in e). Scale bar, 200 μm (b); 40 μm (c–e). f–h, Bilateral photoinhibition of avBST neuron axons in vlPAG during TS (f) led to a marked increase in immobility behavior (*p < 0.05), whereas radioimmunoassay of ACTH (g) and CORT levels (h) in YFP and Arch animals failed to reveal any significant differences in HPA activation. n = 5 YFP, n = 6 Arch (f–h).
