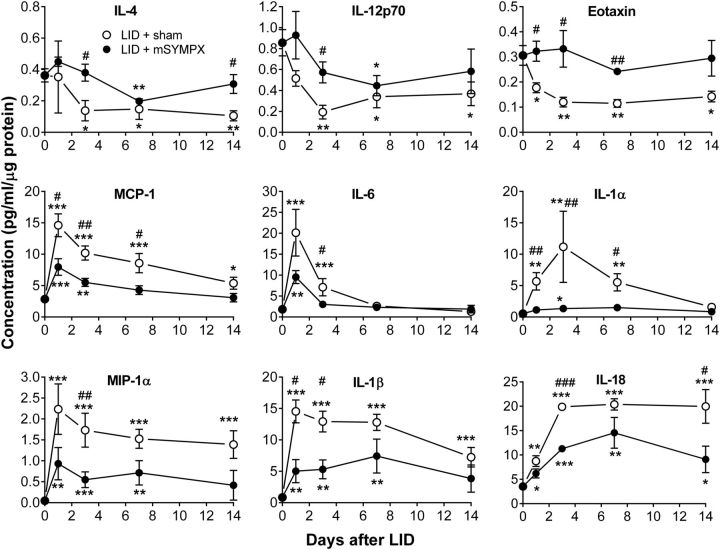
Figure 6.
Examples of cytokine profiles after local DRG inflammation with mSYMPX or sham mSYMPX performed 7 d before DRG inflammation (POD 0). The concentrations in the DRG samples (pg/ml) were divided by the μg protein present in the sample. Normal DRG values (samples taken from normal animals with no surgical procedures) are plotted on day 0. Top, Examples of cytokines from Group 1 that were decreased by LID and partly normalized by mSYMPX. Middle, Examples of pro-inflammatory cytokines from Group 2 that were initially increased by LID and partially normalized by mSYMPX. Bottom, Examples of pro-inflammatory cytokines from Group 3, showing a more sustained increase after LID and partially normalized by mSYMPX. Significant fold change compared with normal DRG at the indicated time point: *p < 0.05; **p < 0.01; ***p < 0.001. Significant difference in fold change between sham mSYMPX and mSYMPX groups on the indicated days (ratio t test): #p < 0.05; ##p < 0.01; ###p < 0.001. N = 5 normal samples and 4 samples per group in all other groups. See also Table 2.

