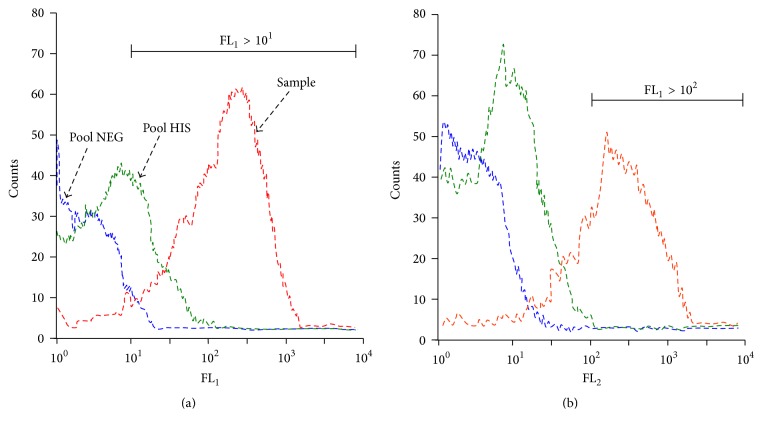
Figure 1.
Examples of histograms of flow cytometry data acquisition. The two histograms show results from the acquisition of 5,000 events of a 3% P. falciparum culture after gating on FL1 > 101 (a) and on FL1 > 102 (b). The gating on high FL1 values (>102) selected the mature population of the cultured parasites. The binding of human IgG to IRBC was revealed by an anti-IgG conjugated to thiazole orange (TO). The fluorescence of TO-positive iRBCs was measured in the FL2 channel. The reference negative control (blue curve histogram, Pool NEG), the positive control (green curve, Pool HIS), and a strong responder from Ndiop (red curve, positive sample) are shown. Analysis was done by Flow Jo® Software.

