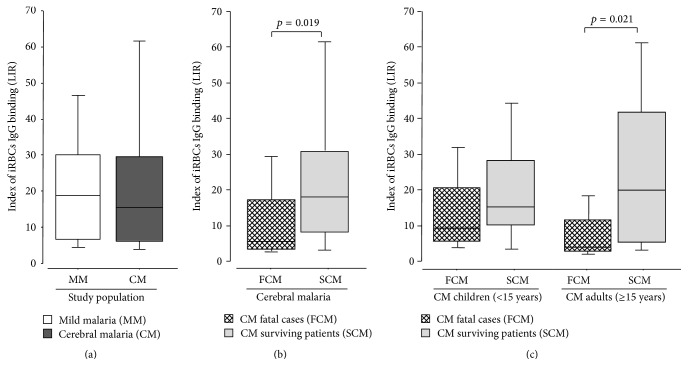
Figure 3.
Variations of labeling index ratio according to disease severity (a), CM outcome (b), and age of individuals in CM patients (c). Box plot of labeling index ratio (LIR). The horizontal line within each box represents the median value of LIR. Comparison were done (a) between mild malaria patients (MM, n = 35; white boxes) and cerebral malaria group (CM, n = 69; dark boxes), (b) between fatal cerebral malaria group (FCM; n = 18; hacked boxes) and surviving cerebral malaria patients (SCM; n = 51; grey boxes), and (c) in CM patients according to both outcome and age of children (left) and adults (right). The Mann-Whitney rank test was employed for comparison between groups. Sera from survivors showed significant high LIR compared to fatal CM patients (p < 0.05) in adults. Significant p values are included.

