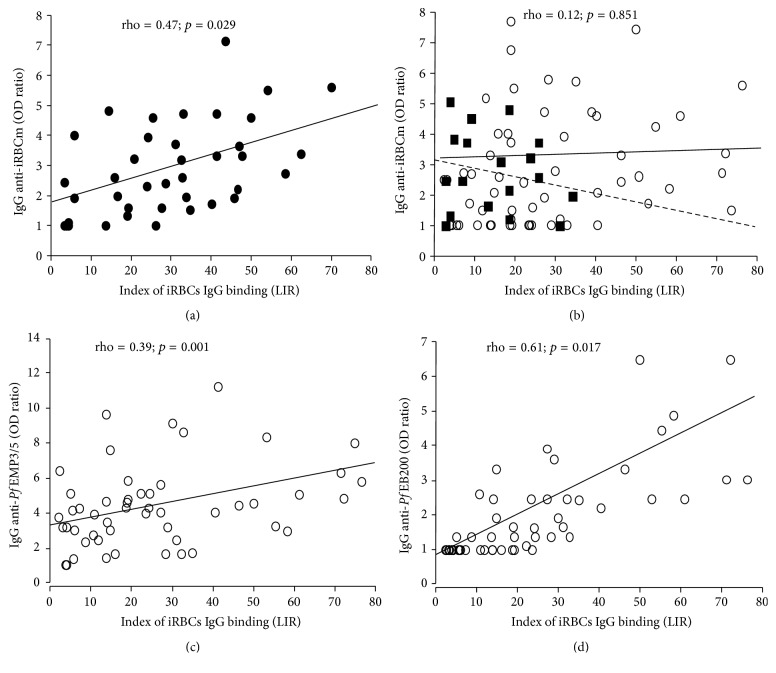
Figure 4.
Relationship between labeled index of recognition and IgG responses in MM (a) and CM (b–d) groups. The correlations between labeled index of recognition (LIR) and IgG anti-iRBCm levels (OD ratio) are plotted in MM patients (a) (dark circles) and in CM group (b) with a dichotomization in fatal CM (dark squares) and surviving CM (open circles). Relationships between LIR and the levels of IgG anti-PfEMP3/5 (OD ratio) or IgG anti-PfEB200 levels (OD ratio) are, respectively, plotted in (c) and (d), only in CM surviving patients (open circles). Results from statistical analyses done by nonparametric Spearman rank test are indicated.

