Figure 3.

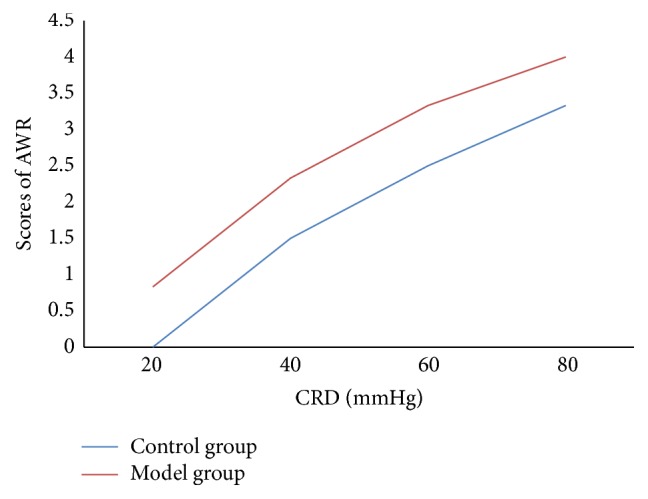
Scores of AWR. In the model group, when the pressure of CRD was 20, 40, 60, or 80 mmHg, score of AWR is significantly higher than that in the control group (t = 5.00, P < 0.01; t = 2.71, P < 0.05; t = 2.71, P < 0.05; t = 3.16, P < 0.05).

Scores of AWR. In the model group, when the pressure of CRD was 20, 40, 60, or 80 mmHg, score of AWR is significantly higher than that in the control group (t = 5.00, P < 0.01; t = 2.71, P < 0.05; t = 2.71, P < 0.05; t = 3.16, P < 0.05).