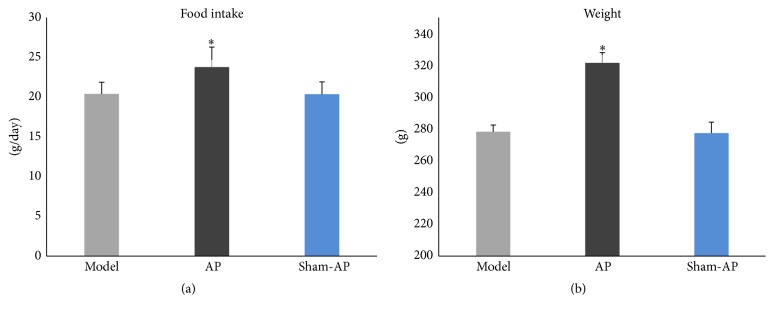
Figure 7.
Food intake and weight. There is significant difference in daily food intake among the three groups (F = 6.33, P < 0.05) (a). In the AP group, food intake is significantly higher than that in the model group (P < 0.05), and there is no significant difference between the model group and the sham-AP group; there is significant difference in weight among the three groups (F = 108.12, P < 0.01) (b). In the AP group, weight is significantly higher than that in the model group (P < 0.05), and there is no significant difference between the model group and the sham-AP group. ∗ P < 0.05.

