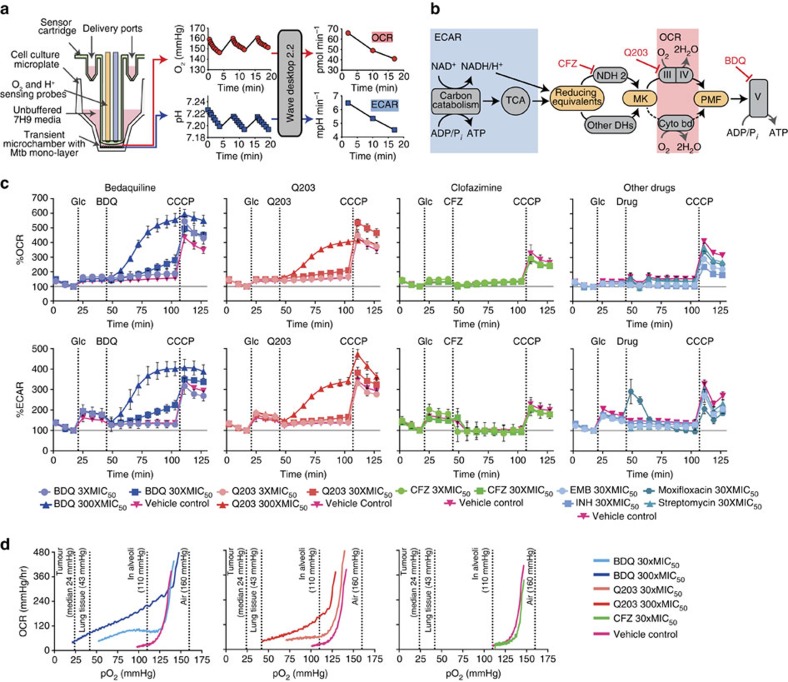
Figure 1. Diagram of the Seahorse XF Analyzer, its function and the initial bioenergetics analysis of Mtb in the presence of the ETC inhibitors.
(a) Compounds are delivered into microplate wells via drug ports. When the probe is lowered, a transient microchamber is formed above a monolayer of bacilli. Dissolved O2 and pH are monitored by sensing probes. Oxygen consumption rate (OCR) and extracellular acidification rate (ECAR) are calculated from these measurements by the instrument software. (b) ECAR represents carbon catabolism and TCA cycle activity, which produce reducing equivalents that enter the ETC. Reducing equivalents pass through NDH2 or other dehydrogenases (DHs) to the menaquinone pool (MK), and then through Complexes III (cytochrome bc1) and IV (cytochrome aa3), or through cytochrome bd to O2. This contributes to the PMF, which powers ATP synthesis by Complex V (ATP synthase). CFZ acts on NDH2. Q203 inhibits Complex III. BDQ inhibits Complex V. (c) Bioenergetic analysis of Mtb. At the indicated times, 2 g l−1 of glucose (Glc) was added, followed by BDQ, Q203, CFZ, or other drugs, followed by the uncoupler CCCP to stimulate maximum respiration. BDQ and Q203, unlike CFZ or standard antimycobacterial drugs, induce an increase in bacterial respiration, above that of their respective vehicle controls. OCR and ECAR are indicated as a percentage of baseline values. Standard deviation of three replicate wells are indicated as calculated by the Seahorse XF Wave software. One representative experiment is shown; for ETC targeting drugs, at least three replicate experiments were performed. The following inter-experiment % CVs were calculated using Microsoft Excel (Microsoft Office 2010): basal OCR 47.2±5.2; % CV 11.1 (n=6), increased OCR after BDQ addition; 129.7±5.2, % CV 4.1 (n=4) and increased OCR after Q203 addition; 104.1±11.1, % CV 10.7 (n=4). The absolute value OCR profiles are shown in Supplementary Fig. 1. During optimization it was determined that fewer than 5% of the bacteria seeded into microplate wells were dislodged from the bottom during the experiment. (d) O2 depletion from microchamber sustained for 2 h. Each condition was repeated at least four times; representative traces are shown.

