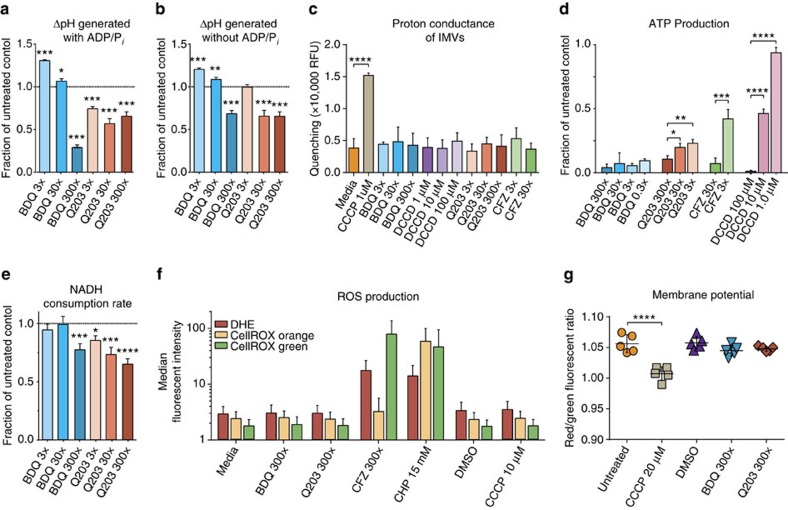
Figure 2. IMV, ROS and membrane potential experiments.
ΔpH measured by quenching of fluorescent probe ACMA, ATP production measured with luciferase/luciferin system, the rate NADH consumption was monitored at 340 nm, ROS production via flow cytometry with ROS-sensitive dyes dihydroethidium (DHE), CellROX Orange and CellROX Green, and bacterial membrane potential with the BacLightTM Membrane Potential kit via flow cytometry. (a) ΔpH generated by IMVs in the presence of NADH, with ADP and phosphate in the reaction buffer. (b) ΔpH generated by IMVs in the presence of NADH, without ADP or phosphate. (c) Proton conductance of IMVs. ΔΨ was generated by valinomycin treatment of IMVs in potassium-free buffer, ΔpH generation was taken as an indication of membrane permeability to protons. (d) ATP production by IMVs provided with NADH. (e) Rate of NADH consumption by IMVs in the presence of saturating concentrations of NADH (250 μM). (f) Median fluorescent intensity of ROS-sensitive dyes in treated Mtb mc26230 cells. (h) Shifts in the red/green median fluorescent intensity ratio after control and drug addition shows that neither BDQ nor Q203 have a measurable effect on Mtb membrane potential, whereas CCCP does. Error bars are standard deviations of three replicate experiments, except for subpanel (f), for which the interquartile range of a single experiment is shown, and (g), for which five biological replicates were used. P-values were determined by one-way analysis of variance using GraphPad Prism 6.05. *P<0.05, **P<0.005, ***P<0.0005 and ****P<0.0001.

