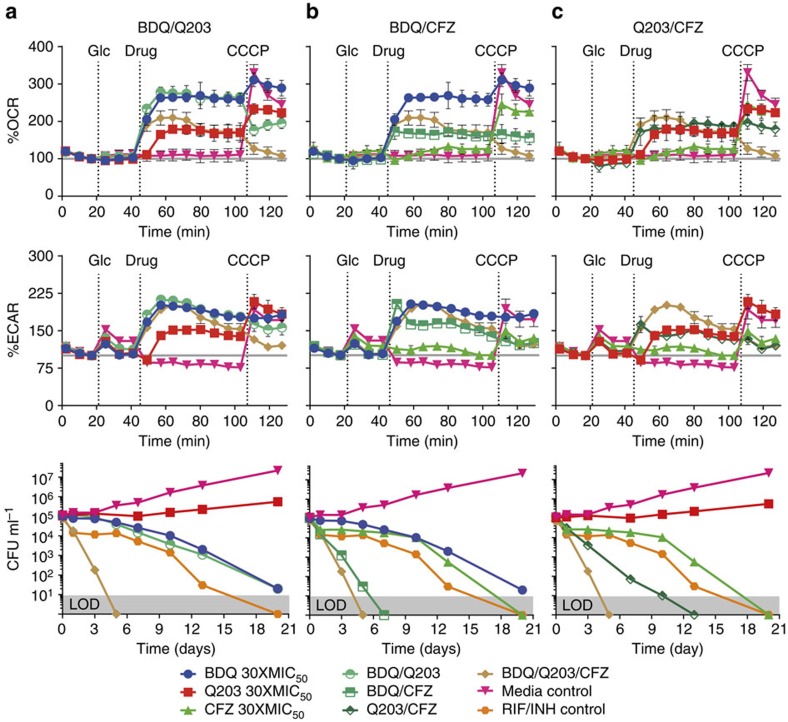
Figure 4. Analysis of combination treatment of Mtb H37Rv.
Indicated additions are 2 g l−1 glucose (Glc), drug combination, and 2 μM CCCP as an uncoupler to stimulate maximum respiration. OCR and ECAR are shown as a per cent of baseline values with standard deviation of three replicate experiments performed. Kill curves were constructed from CFUs measured over 20 days of treated cells grown in 7H9 with 2 g l−1 of glucose and 0.01% tyloxopol. Limit of detection (LOD) is 10 CFU per ml. All drugs were added at 30 × MIC50 values. Two separate kill curve experiments were performed with the same results, representative data is shown. (a) BDQ, Q203, BDQ/Q203, and BDQ/Q203/CFZ combinations. (b) BDQ, CFZ, BDQ/CFZ and BDQ/Q203/CFZ combinations. (c) Q203, CFZ, Q203/CFZ, and BDQ/Q203/CFZ combinations.

