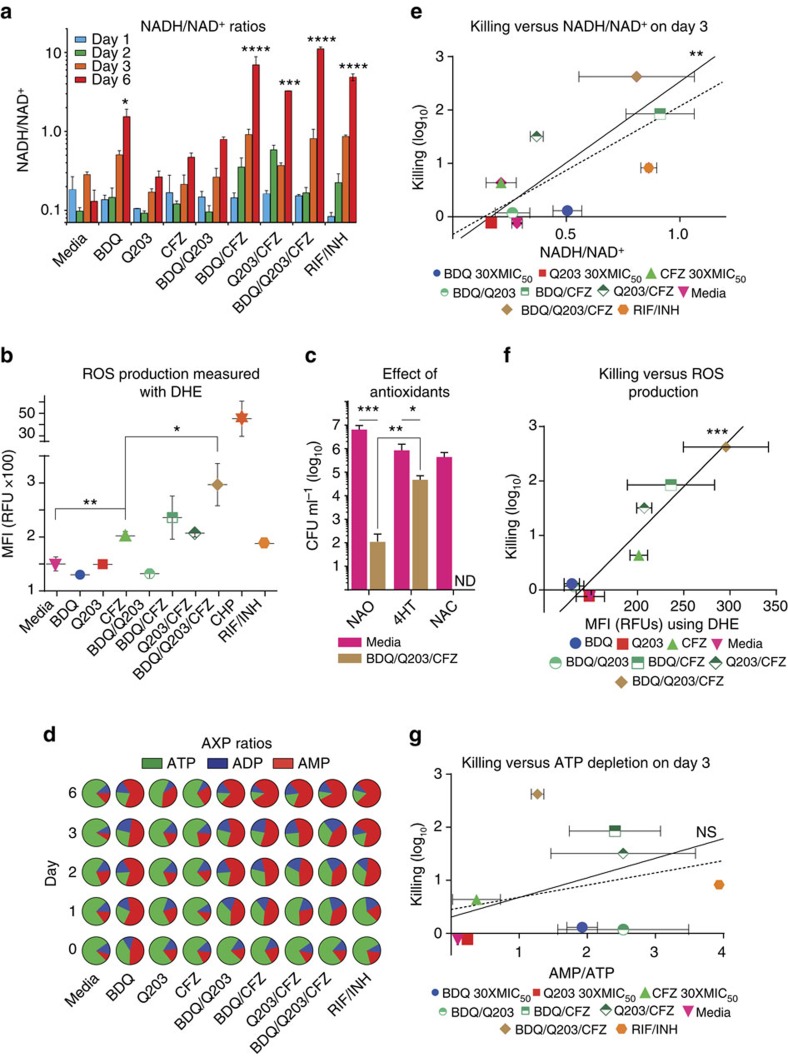
Figure 5. Assessment of contributors to rapid synergistic killing of CFZ-containing combinations.
(a) NADH/NAD+ ratios of cells cultured with indicated drug combinations at 30 × MIC50, as measured by LC-MS/MS. (b) ROS produced by cells cultured with indicated drug combinations at 30 × MIC50, as measured by flow cytometry with DHE. (c) The killing efficacy of the BDQ/Q203/CFZ under three different conditions after 5 days of treatment: no antioxidant (NAO), 4-Hydroxy-Tempo (4HT) and N-acetyl-cysteine (NAC). Representative data is shown of three independent experiments performed. Limit of detection (LOD) is 10 CFU per ml. ND, not detected. (d) ATP, ADP, and AMP ratios of cells cultured with indicated drug combinations at 30 × MIC50, as measured by LC-MS/MS. All experiments were performed in triplicate; error bars indicate standard deviation of measurements. *P<0.05, **P<0.005, ***P<0.0005 and ****P<0.0001 (one-way analysis of variance using GraphPad Prism 6.05). Correlation between reduction in CFU per ml (log10) at Day 3 as a measure of early, rapid killing, and (e) reductive stress, (f) oxidative stress, and (g) ATP depletion stress. Correlations are shown for all drugs (dotted line), as well as for ETC-targeting drugs only (solid line). Excluding RIF/INH control, which is expected to have a different mechanism of action, linear correlation statistics were determined using GraphPad Prism 6.05 and are as follows: (e) R2=0.83, P=0.002; (f) R2=0.91, P=0.0002; (g) R2=0.137, P=0.4.

