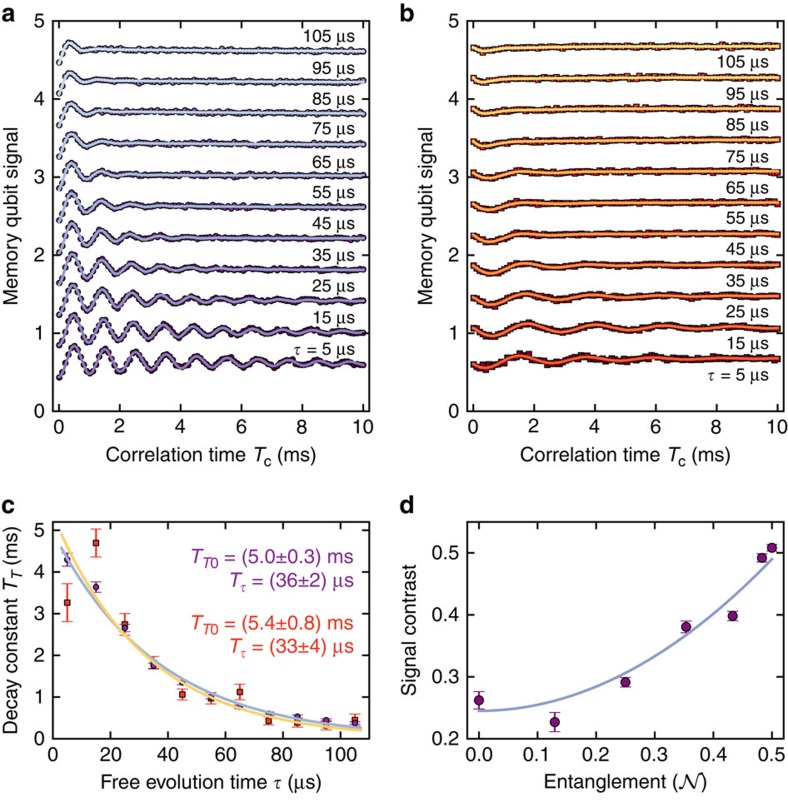
Figure 2. Comparison of enhanced and conventional correlation measurements.
(a,b) Stacks of correlation measurements for full ((a) η=1) and no entanglement ((b) η=0) between sensor and memory qubit for various sensing times  as stacking parameter. Associated measurement sequences are given in Fig. 1c. The memory readout signal (that is, the probability of detecting state
  ) is plotted against the correlation time Tc (stack-offset n·0.4, n∈{0, 1, … 10}). Oscillations on the signal are introduced artificially by a phase offset
  , fT=1 kHz (a) and fT=0.5 kHz (b) to sample the stored quantum phase (see equations 6 and 7). All data sets are fit by
  . (c) Fit values for decay constant TT over
  for no (squares, orange) and full (circles, purple) entanglement of sensor and memory. The function
  is fit to the weighted data and the corresponding parameters are displayed. (d) Signal contrast A0 for Tc=0 over entanglement between sensor and memory qubit (given as negativity
  , see the ‘Methods' section). All error bars give standard errors taken from the used least square fit.

