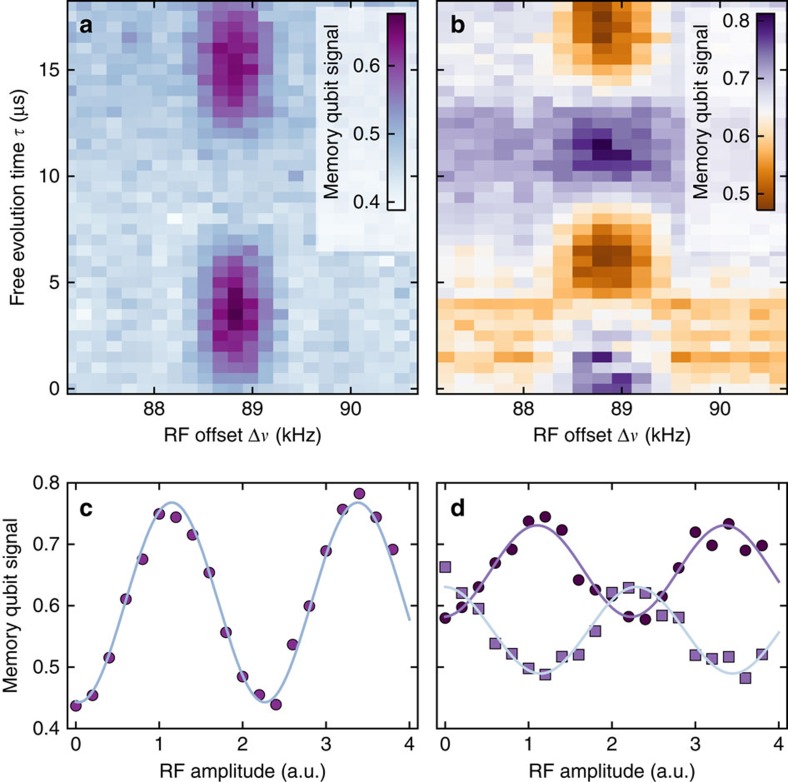
Figure 3. Sensing a single nuclear spin.
(a,b) Colour-coded memory qubit signals (that is, probability of detecting state  ) of enhanced correlation measurement with an RF pulse during Tc=1 ms. Sensing time
  and RF pulse frequency offset Δν to the bare 13C Larmor frequency are varied (cf. Mims electron-nuclear-double-resonance (ENDOR)29). A resonance of a 13C spin around Δν=89 kHz appears, where, for increasing
  , the phase Δφ of the memory increases. The width of the 13C spin controlled phase accumulation of about 1 kHz is governed by the RF pulse duration. a,b show cos Δφ and sin Δφ of the memory phase because the phase
  of the final memory qubit π/2-pulse is set to 0 (a) and π/2 (b) (see Fig. 1c). Please note, that for the measurements done with
  (b) initialization of the 13C spin is required (here: spin down, see main text). Variations of the background in panel (b) are due to drifts of Δω (see equation 6, see the ‘Methods' section). (c,d) On resonance, the RF pulse amplitude is varied, to induce Rabi oscillations of the detected 13C spin. Phases
  are 0 in (c) and ±π/2 in (d) for circles and squares.

