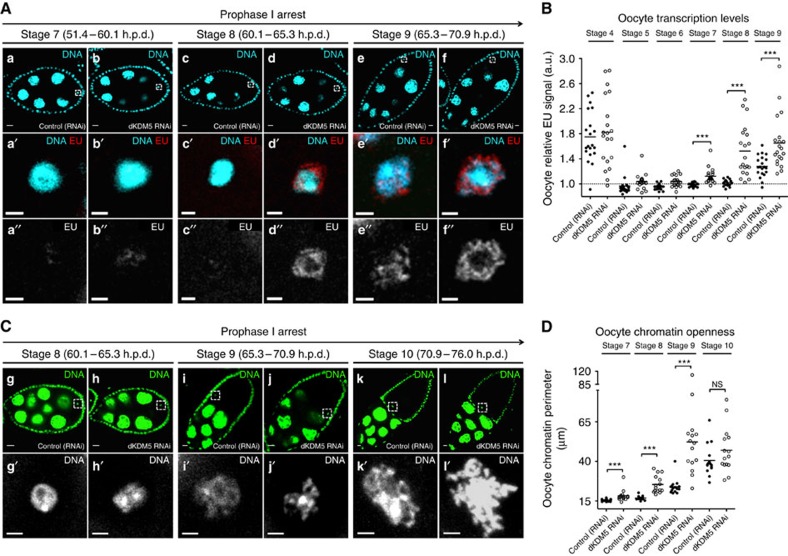
Figure 4. dKDM5 temporally regulates the reactivation of transcription and chromatin remodelling during the prophase I arrest.
(A,B) The germ line-specific knockdown of the histone demethylase dKDM5 results in the premature transcriptional reactivation of prophase I-arrested oocytes (a–f′′) Oocyte transcription was robustly detected approximately 14 h earlier in dKDM5-depleted conditions when compared with controls: oogenesis stage 7 versus stage 9, respectively. Oocyte transcription was measured by incorporation of the modified nucleotide ethynyl uridine (EU). The specificity of this assay for nascent RNA was confirmed by treatment with the transcription inhibitor Actinomycin D (Supplementary Fig. 13). Signal quantification (B) is represented per oocyte and is expressed in fluorescence arbitrary units (a.u.). Horizontal lines specify mean values and asterisks indicate significant difference (Mann–Whitney U-test; P≤0.0005). Similar results were obtained with a dkdm5−/− mutant (Supplementary Fig. 4C,D). (C,D) Meiotic chromosome compaction is remodelled during transcriptional reactivation (g–l′). Under control conditions, the karyosome-compacted meiotic chromosomes resolve into chromatin protrusions for a period of ∼11 h in late prophase I (from oogenesis stages 9 to 11). dKDM5 knockdown doubled this period to ∼20 h by inducing karyosome opening starting from stage 7 and introduced significant morphological abnormalities to the chromatin (j′,l′). The perimeter of oocyte chromatin (in μm) was measured for phenotypic quantification of chromatin openness (see D). Horizontal lines specify mean values, asterisks indicate significant difference and ‘NS' no significant difference (Mann–Whitney U-test; P≤0.0002). Similar results were obtained with a dkdm5−/− mutant (Supplementary Fig. 4I,J). (A–D) Development time in relation to the start of oogenesis is expressed in hours post-germ line stem cell division (h.p.d.). Rectangles delimit the area of the oocyte insets. Scale bars, 10 μm for ovarian follicles and 2 μm for oocyte insets.

