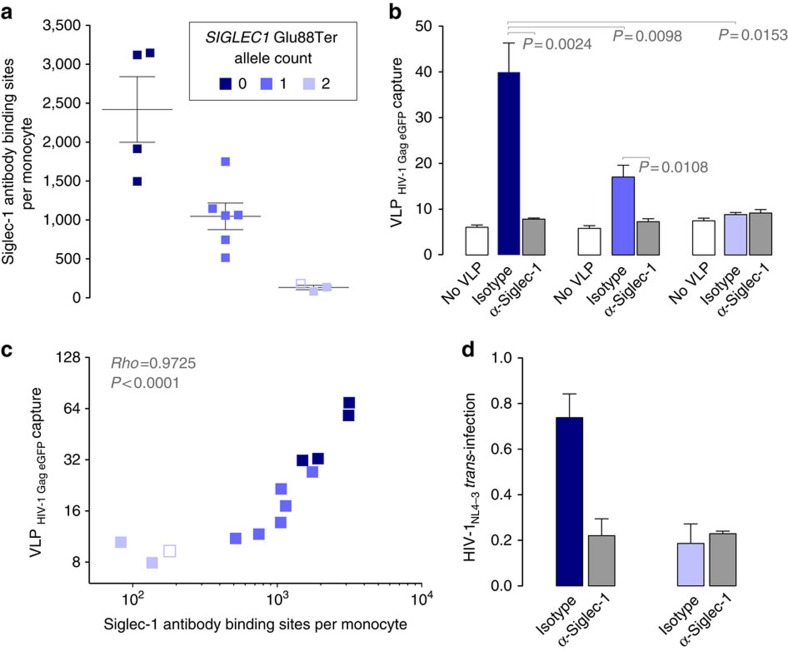
Figure 2. Siglec-1 expression and trans-infection across distinct SIGLEC1 genotypes.
Monocytes were isolated and cultured 24 h in the presence of 1,000 U ml−1 of IFNα to induce Siglec-1 expression. (a) Quantification of Siglec-1 expression levels assessed by flow cytometry. Empty box represents a repeat analysis of one Siglec-1 null homozygote. (b) Capture of fluorescent HIV-1 VLPs by monocytes from distinct genotypes previously exposed to isotype or α-Siglec-1 mAbs. Geometric mean fluorescence intensity of monocytes not exposed to VLPs is also depicted to show the background levels of the assay (empty bars). (c) Correlation between Siglec-1 expression levels and viral capture values of isotype-treated monocytes. (d) HIV-1 transmission to a reporter CD4+ cell line from monocytes of opposing homozygous individuals pre-incubated with isotype or α-Siglec-1 mAbs. HIV-1 infection of reporter cells was determined by induced luciferase activity. Data show mean relative light units and SEM of cells from two homozygous individuals with the common allele and one Siglec-1 null homozygote.

