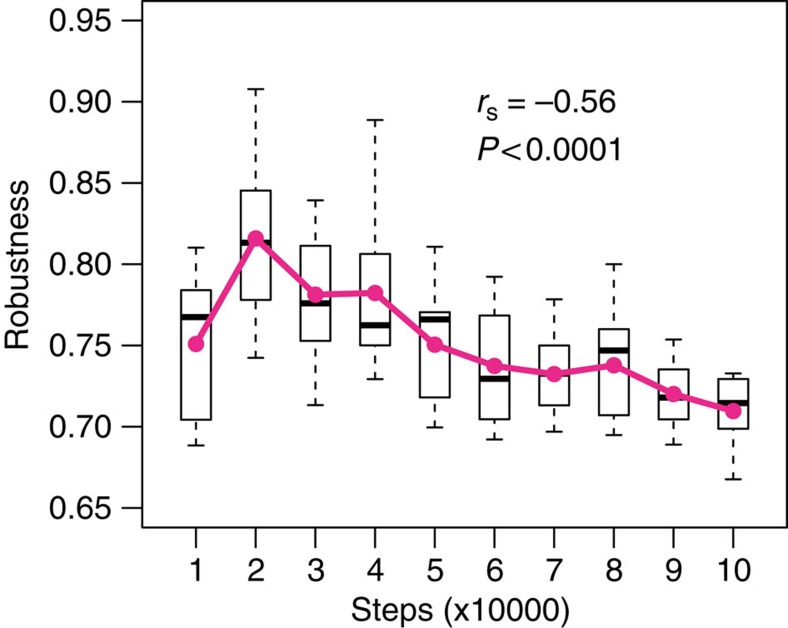
Figure 4. Robustness to novel conditions in Avida declines over time due to a tradeoff with the adaptation to stable conditions.
Solid lines and dots indicate average values. The Spearman-rank correlation coefficient was computed on all raw data (that is, not on the averaged values shown in the plots). Boxes indicate first and third quartiles, whiskers indicate range values and horizontal lines indicate median values.

