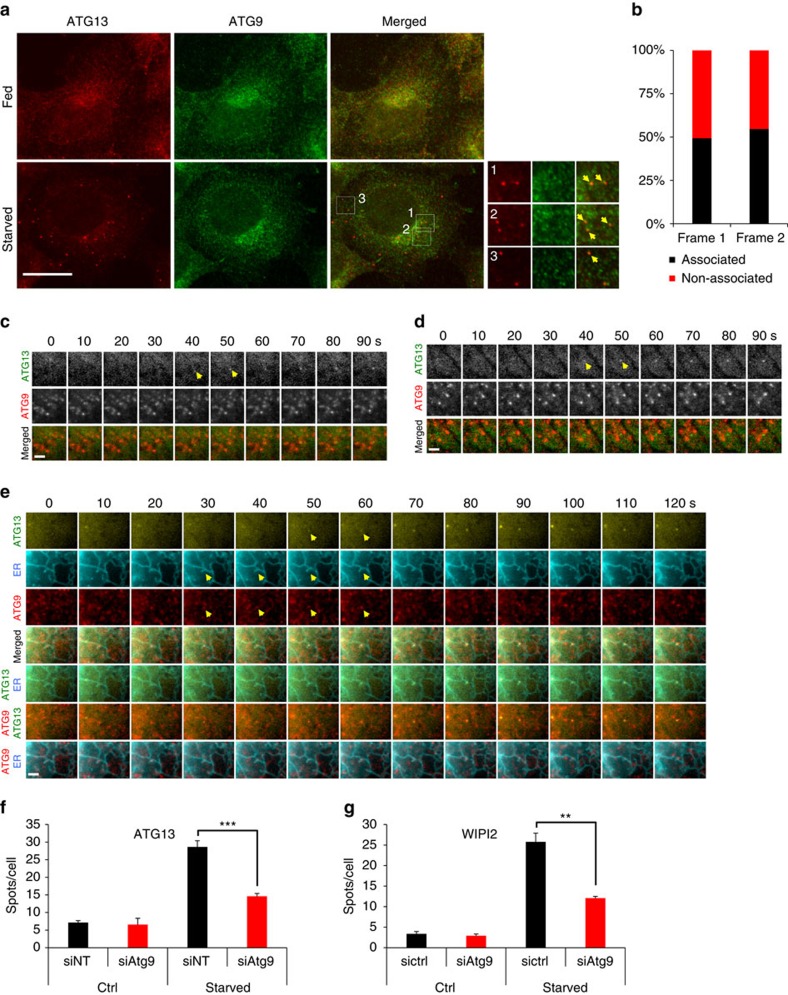
Figure 4. ATG9 promotes the formation of ATG13 puncta.
(a) HEK293 cells were either fed or starved for 1 h, immunolabelled for ATG13 and ATG9 and imaged by wide-field microscopy. Arrowheads in inserts point at ATG13 particles associating with ATG9. Bar corresponds to 10 μm. (b) Values are ATG13 particles in c,d associating with ATG9 particles in the first two frames from their emergence. From analysis of 75 montages. (c,d) Wide-field live-cell imaging of starved HEK293 cells stably expressing GFP-ATG13 and mRFP-ATG9. Representative montages of ATG13 particles forming in association with ATG9 (c) or not (d) are shown. Arrowheads point at the ATG13 particles in the first two frames from their emergence, the same that were used for the analysis in b. (e) Wide-field live-cell imaging of starved HEK293 cells expressing stably GFP-ATG13 and mRFP-ATG9, and transiently CFP-ER. Representative montage of ATG13 particle forming on a tubular extension of ER previously hosting an ATG9 vesicle is shown. Arrowheads point at the ATG13 particle in the first two frames from its emergence and at the associating extension of ER and ATG9 vesicle. (f,g) HEK293 cells were transfected with non-targeted (siNT) or ATG9 (siATG9) siRNA, starved for 1 h, immunolabelled for ATG13 or WIPI2 and imaged by confocal laser scanning microscopy. Values are means±s.e.m. puncta of ATG13 (f) or WIPI2 (g) per cell, for at least five different fields with 15–30 cells each. Significance levels were determined with unpaired t-tests. Bar in c–e corresponds to 300 nm. **P=0.01%; ***P=0.001%.

