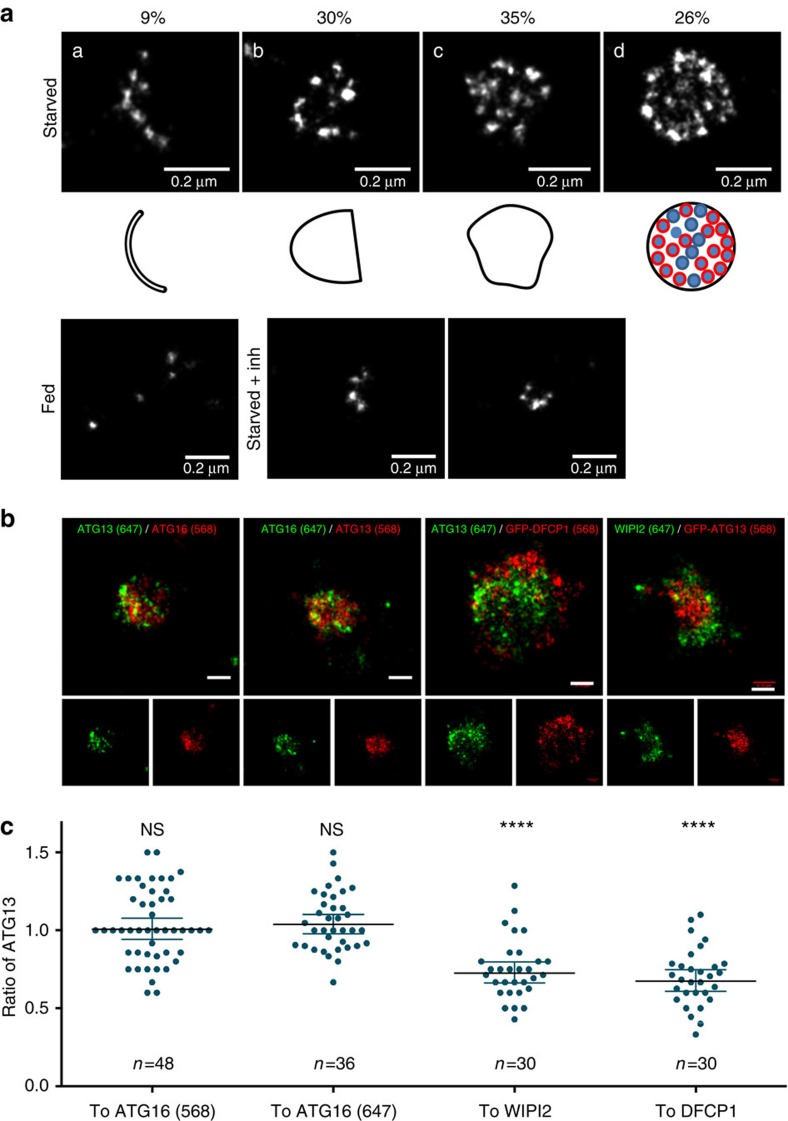
Figure 6. ATG13 shows unique distribution pattern on autophagosome membranes.
(a) HEK293 cells were fed or starved in the presence or absence of VPS34 inhibitor for 1 h, immunolabelled for endogenous ATG13 and imaged by dSTORM. The structures of observed ATG13 particles under starved conditions were assigned to four different patterns: crescent shaped (a), semi-spherical (b), quasi-spherical (c) and spherical (d). Representative examples of reconstructed super-resolution images are shown for each pattern. Shapes below the images describe the outline of each observed pattern. Red circles within the spherical pattern correspond to areas of higher density of identified molecules. Values are the percentage of ATG13 particles corresponding to each pattern; from 120 particles analysed. (b) HEK293 cells stably expressing GFP-DFCP1 or GFP-ATG13, or the parental cell line were starved, immunolabelled for ATG13, WIPI2, ATG16 or GFP and imaged by dSTORM. Representative examples of reconstructed super-resolution images are shown. Bar corresponds to 0.15 μm. (c) The area occupied by ATG13 and ATG16 (labelled with Alexa Fluor 647- or CF 568- conjugated secondary antibody), WIPI2 or GFP-DFCP1 in the reconstructed super-resolution images in b was quantitated. Values are the ratios of ATG13–ATG16, WIPI2 and DFCP1 in each of the analysed particles. Significance levels were determined with one-sample t-test against a theoretical mean of 1 (if ATG13 and ATG16, WIPI2 or DFCP1 occupied the same area), with Bonferroni correction for multiple comparisons. ****P=0.0001%.

