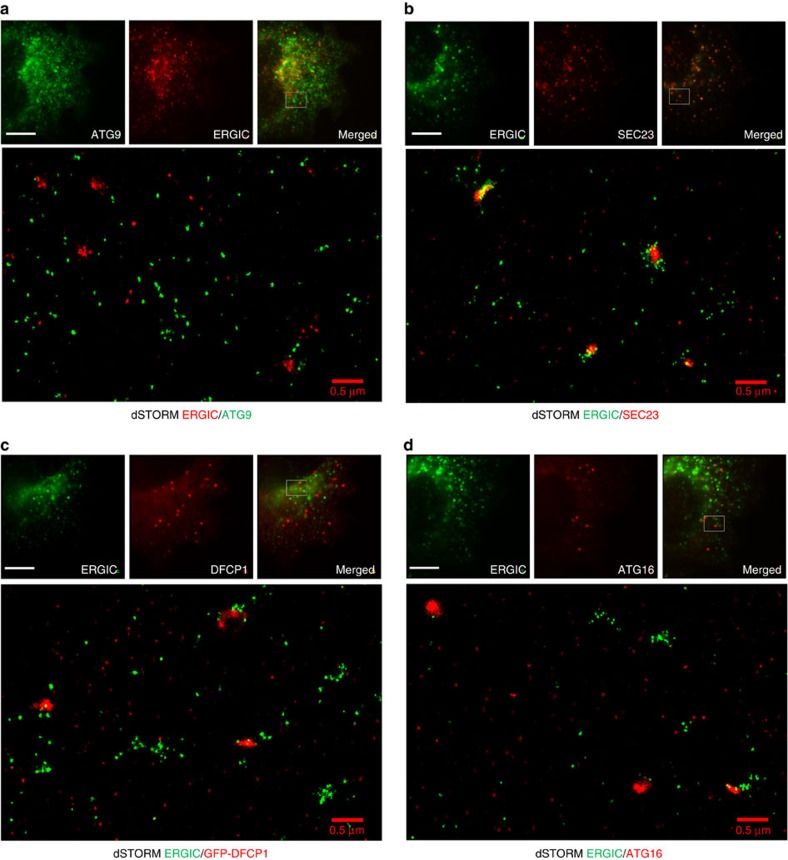
Figure 8. dSTORM imaging of ERGIC.
Parental HEK293 cells (a,b,d) or HEK293 cells stably expressing GFP-DFCP1 (c) were starved, immunolabelled for ERGIC53 and ATG9 (a), SEC23 (b), GFP(c) or ATG16 (d) and imaged by dSTORM. Representative conventional images and super-resolution magnifications are shown. Scale bars in wide-field images, 5 μm. Scale bars in super-resolution images, 0.5 μm.

