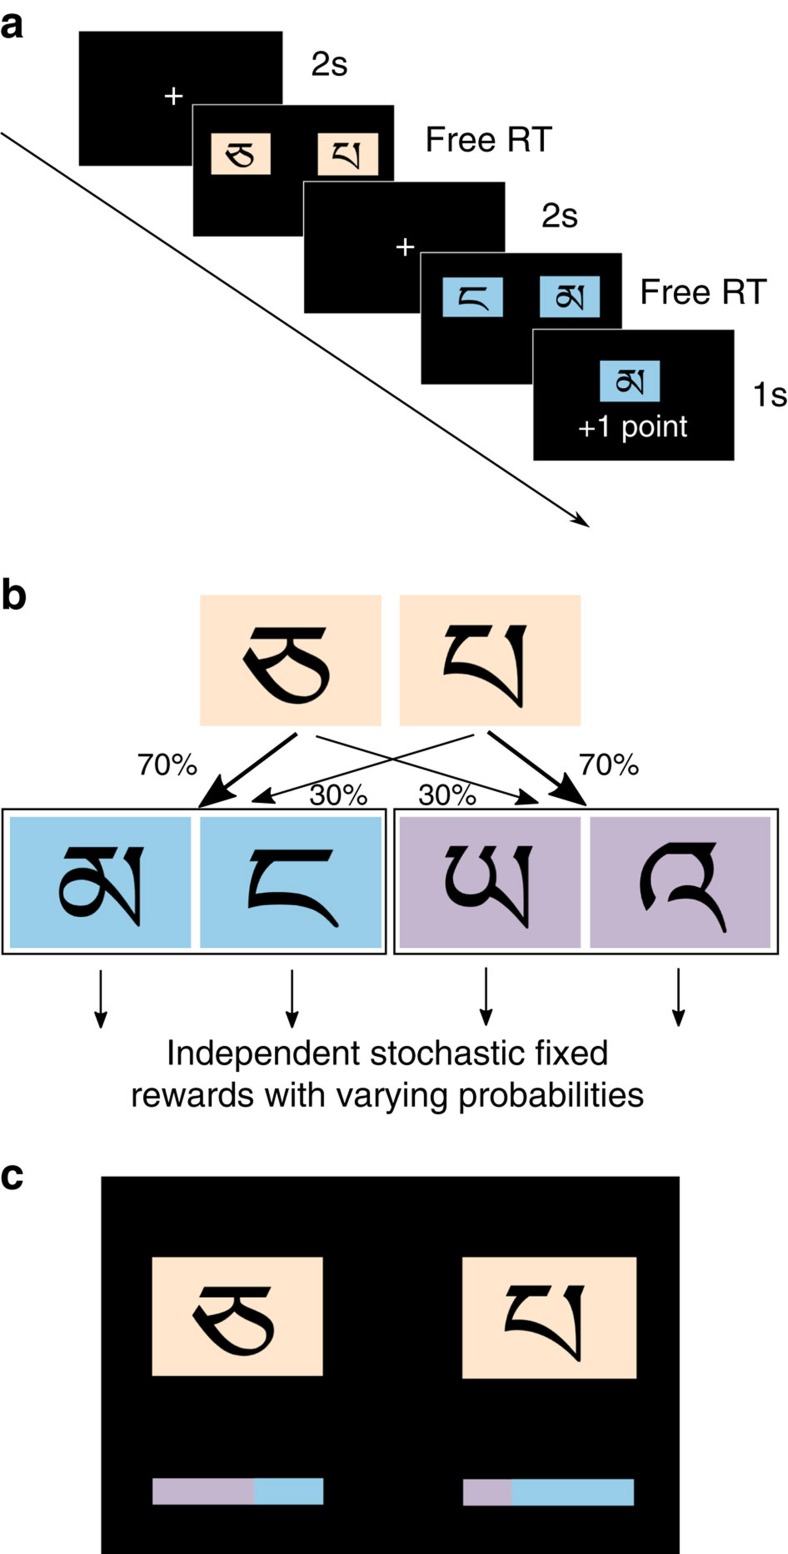
Figure 1. Experimental design.
(a) Choice-trial timeline. Subjects are forced to fixate at the center of the screen for 2 s before every choice. A first stage choice between two beige symbols yields one of two second-stage states with either blue or purple symbols. Once one of the symbols is selected, it is shown in the center of the screen for 2 s, and the stochastic outcome is displayed. (b) Transition structure. One of the first stage symbols is more likely to lead to the blue state; the other is more likely to lead to the purple state. (c) First stage choice screen in the second part of the experiment. The blue/purple coloured bars indicated the change in transition probability on a particular trial (‘colour deviation').

