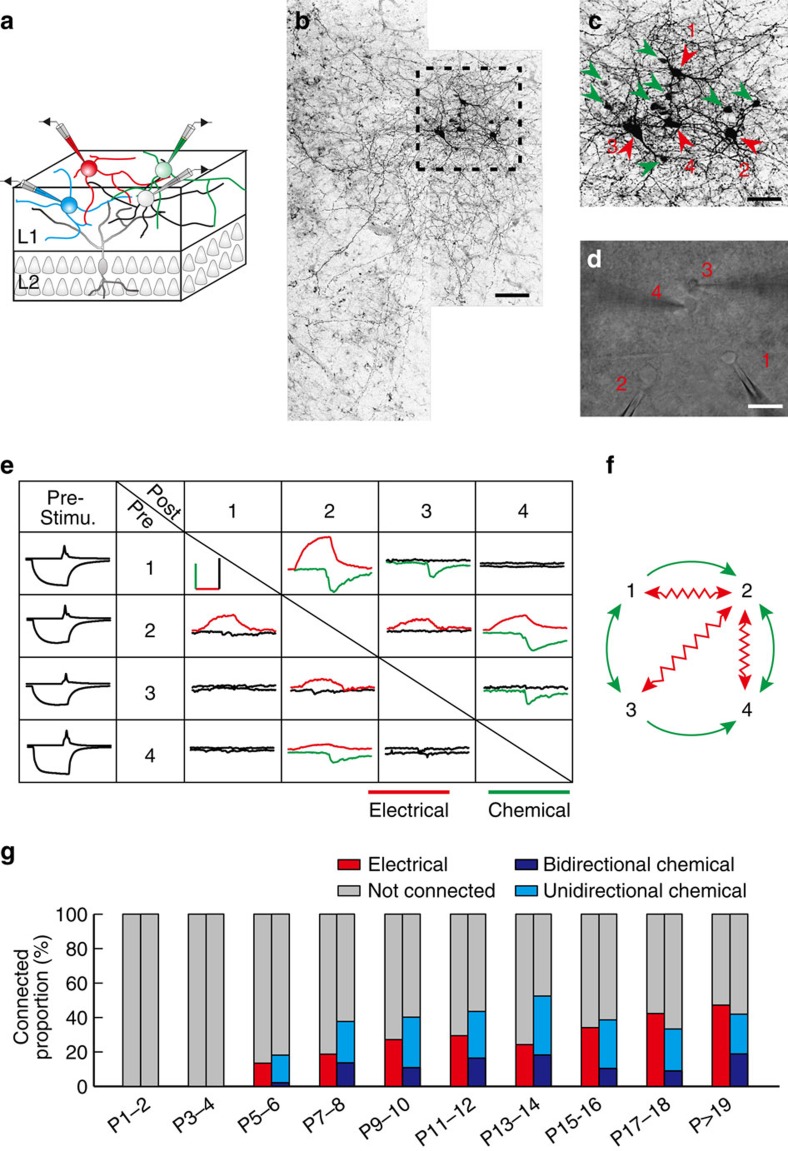
Figure 1. Development of electrical and GABAergic connections between interneurons in neocortical layer 1.
(a) A schematic diagram of a quadruple whole-cell recording of four neurons in cortical layer 1. (b) An image of four layer 1 neurons filled with neurobiotin during recording and labelled with fluorescence-conjugated avidin. Scale bar, 100 μm. (c) A magnified image of b (dotted rectangular region). Red arrowheads indicate the four recorded neurons, and green arrowheads indicate dye-coupled neurons. Scale bar, 50 μm. (d) A DIC image of quadruple whole-cell recording of the four neurons in layer 1 shown in b and c. Scale bar, 50 μm. (e) Summary of the synaptic connections detected in this quadruple recording. The average traces of the postsynaptic responses are shown in the rectangle. Red traces indicate the existence of electrical synapses, and green traces indicate the existence of chemical synapses. Sample traces of AP and hyperpolarization potentials are shown to the left. Scale bar, 40 pA (green vertical scale bar), 20 ms (red horizontal scale bar), 200 mV (black vertical scale bar). ‘Pre-Stimu.', presynaptic potential; ‘Pre', presynaptic neuron; ‘Post', postsynaptic neuron. (f) A schematic diagram showing connections between the four neurons in e. Wavy red arrowheads indicate electrical connections, and green arrowheads indicate chemical connections. (g) Summary of proportion of electrical connections (red bars) and unidirectional/bidirectional chemical connections (light blue bars for unidirectional chemical connections and dark blue bars for bidirectional chemical connections) between interneuron pairs in neocortical layer 1 at different postnatal stages.

