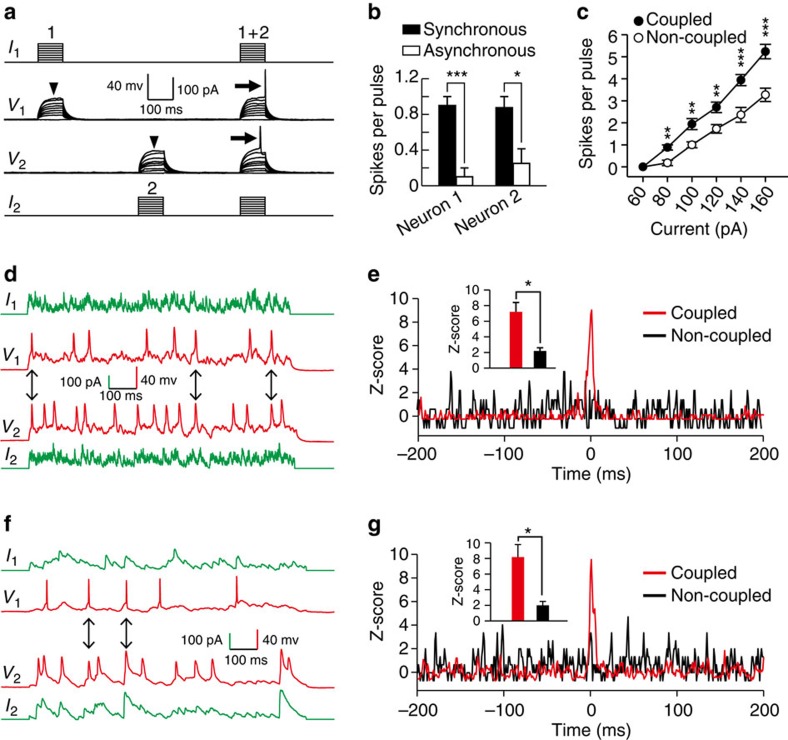
Figure 10. Electrical coupling promotes AP generation and synchronous firing of layer 1 interneurons.
(a) Sample traces of synchronous (1+2) or asynchronous (1 or 2) injection of subthreshold current pulses into electrically coupled interneurons in neocortical layer 1. Note that synchronous injection, but not asynchronous injection (arrowheads), results in AP generation (arrows). (b) Summary of the firing rate of the two interneurons shown in a responding to 80 pA current injection. (c) Summary of the firing rate in electrically coupled or non-coupled interneurons responding to simultaneous current injections. (d–g) Electrical coupling promoting synchronous firing of electrically coupled neurons in neocortical layer 1 in response to uncorrelated simulated neuronal activity (d,e) or uncorrelated native neuronal activity (f,g). (d,f) Sample traces of voltage changes in electrically coupled interneurons. Arrows indicate the spikes that occur in both neurons within a 1 ms window. (e,g) Normalized cross-correlogram (Z-score) analysis. The bin size is 1 ms. Note that the firing frequency is significantly increased near 0 ms for coupled interneuron pairs (red) but not for non-coupled interneuron pairs (black), indicating synchronous firing. The insets show the statistical analysis of Z-scores of coupled/non-coupled interneuron pairs. *P<0.05, **P<0.01, ***P<0.001. Mann–Whitney rank sum test and two-tailed paired t-test. Error bars represent mean±s.e.m.

