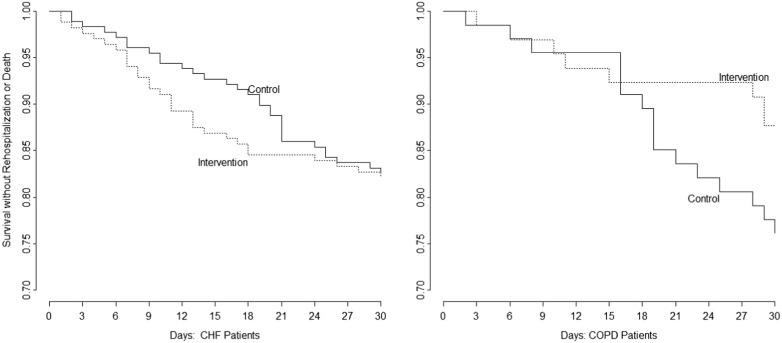
Fig. 2.
Kaplan-Meier curves demonstrating time to rehospitalization or death in the E-Coach intervention or usual care control groups in the first 30 days, stratified by condition. In the congestive heart failure (CHF) group (left panel), there was a nonsignificant trend toward faster time to rehospitalization or death in the E-Coach intervention group (dotted line) versus the usual care control group (solid line) over the first 20 days with no difference between the groups by 30 days. In the chronic obstructive pulmonary disease (COPD) group (right panel), there was a nonsignificant trend toward less rehospitalization and mortality in the E-Coach group (dotted line) than the usual care group (solid line)

