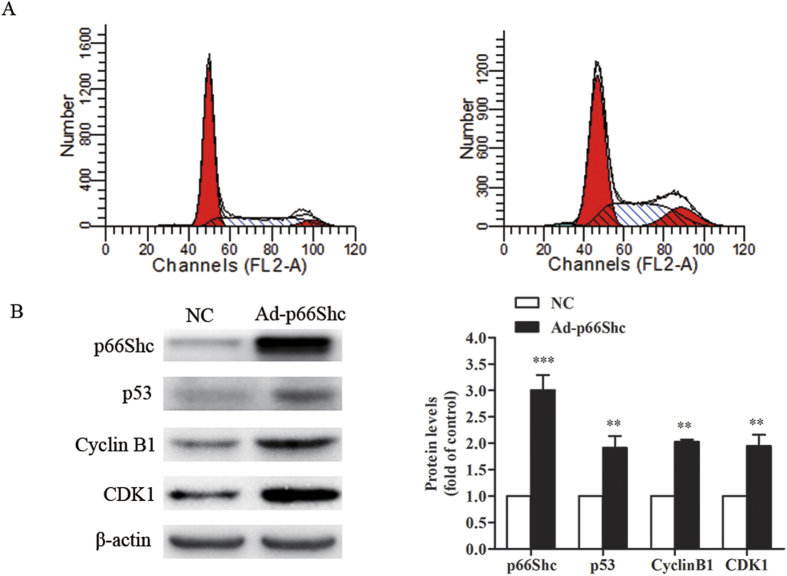
Figure 5. p66Shc induced MCF-7 cell cycle arrest at the G2/M phase.
MCF-7 cells were infected with Ad-p66Shc or negative control for 48 h. (A) After treatment, the cells were examined by flow cytometer for cell cycle analysis. (B) The cell extracts were prepared and analyzed by Western blot with the corresponding antibodies. The quantification of the digital images was performed using ImageJ software. The data represent the means ± SEM, n = 3 independent experiments. **p < 0.01, ***p < 0.001 vs NC (NC: negative control).

