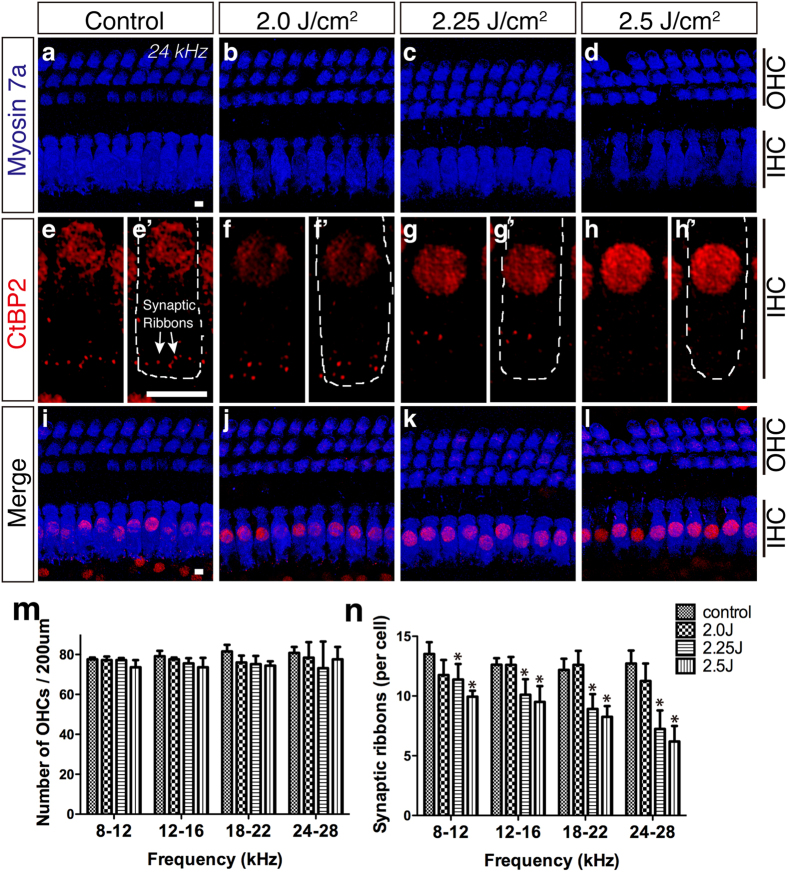
Figure 3. Changes in the organ of Corti after LISW exposure.
(a–i) Confocal images of immunohistochemistry for OHCs (a–d, blue, anti-myosin 7a), synaptic ribbons (e–h, red, anti-CtBP2; the white dotted line in e’–h’ shows the contour of the OHCs; anti-CtBP2 also stains the IHC nuclei), and merged images (i–l) at 24 kHz. (m–n) The number of OHCs (m) and synaptic ribbons (n) 1 month after LISW exposure (n = 5 in each group). Despite ABR threshold shifts observed in the 2.25 and 2.5 J/cm2 groups (c,d), the number of OHCs remained steady 1 month after LISW exposure (m) compared to the control group (a). The numbers of synaptic ribbons were decreased by LISW in an energy-dependent manner (e–h,n). Asterisks indicate significant differences (p < 0.05). Error bars indicate SEs of the means. Scale bar is 5 μm. ABR, auditory brainstem response; IHC, inner hair cell; LISW, laser-induced shock wave; OHC, outer hair cell.

