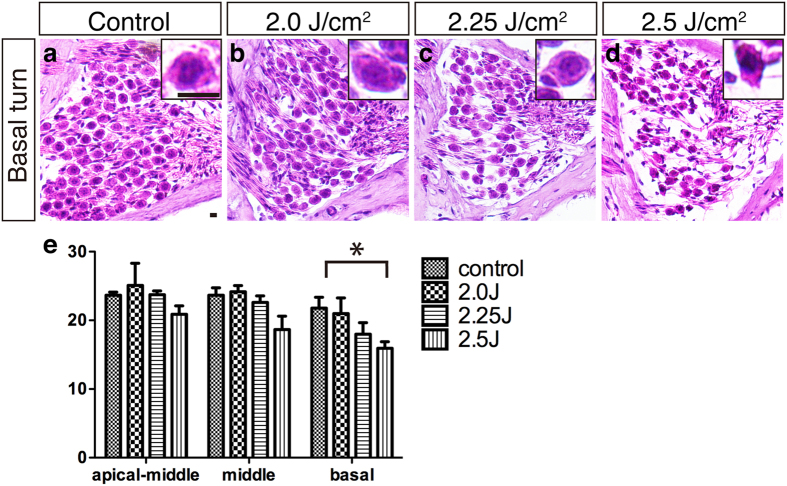
Figure 4. Changes in the spiral ganglion after LISW exposure.
(a–d) Images of the SGCs using HE-stained frozen sections from the cochlear basal turns. Insets show high-power views of a single SGC. (e) The number of SGCs 1 month after LISW exposure (n = 5 in each group). The concentration of SGCs at the basal turn in the 2.5 J/cm2 group was significantly decreased (d,e), compared to the control (a). The basal turn of the SGC in the 2.25 J/cm2 (d, inset) group shows shrinking compared to the control (a, inset). The asterisk indicates a significant difference (p < 0.05). Error bars indicate SEs of the means. Scale bar is 5 μm. LISW, laser-induced shock wave; SGC, spiral ganglion cell; SE, standard error.

