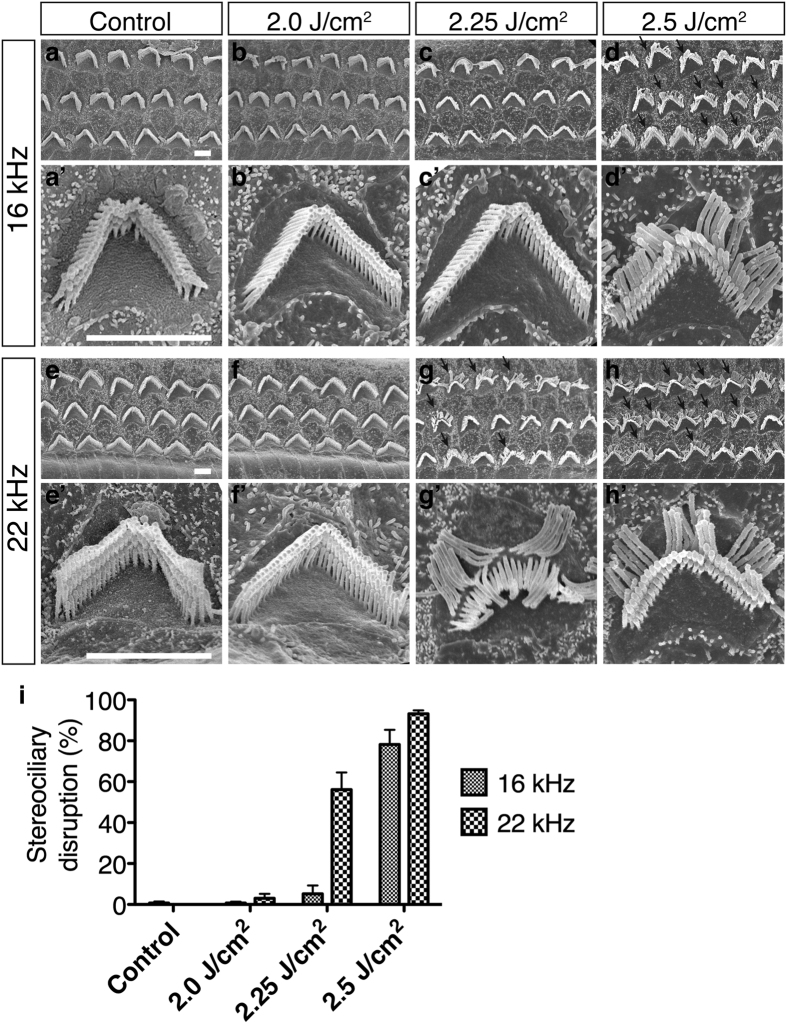
Figure 5. Surface structures in the OHCs.
(a–d) Scanning electron microscopy images of three rows of OHC stereocilia at the 16 kHz organ of Corti area. (a’–d’) high-power views of single OHC stereocilia. (e–h) and (e’–h’) Images from the 22 kHz organ of Corti area. (i) The stereociliary disruption ratio on OHCs one month after LISW exposure (n = 3 in each group). Stereociliary bundle disruption, i.e., the outermost layer of bundles being broken from the root (arrows), was seen in the 2.25 J/cm2 (22 kHz area, g and g’) and 2.5 J/cm2 groups (16 and 22 kHz area, d, h, and d’, h’). Scale bar is 2 μm. Error bars indicate SEs of the means. OHC, outer hair cell; SE, standard error.

