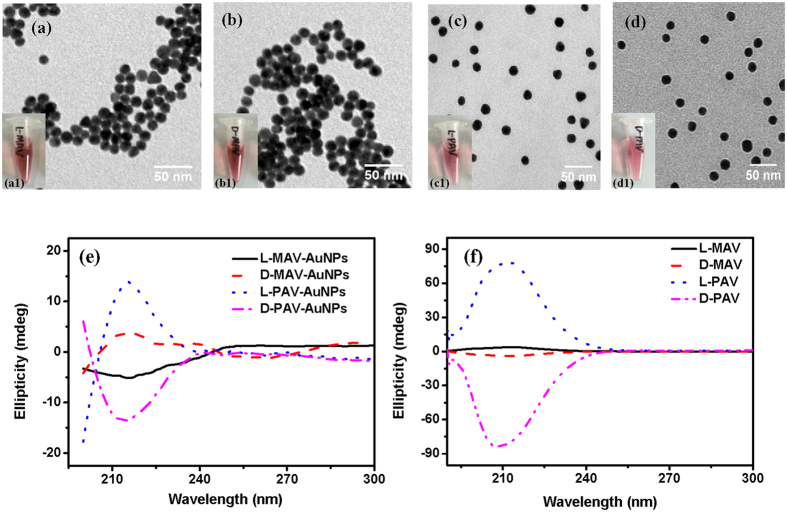
Figure 3.
Nanoparticle characterization. TEM images of (a) L-MAV-AuNPs, (b) D-MAV-AuNPs, (c) L-PAV-AuNPs and (d) D-PAV-AuNPs. Insets are corresponding digital images. CD spectra of (e) L(D)-MAV-AuNPs and L(D)-PAV-AuNPs, and (f) L(D)-MAV and L(D)-PAV molecules. The concentrations of the AuNPs in (e) and the MAV or PAV molecules in (f) were 10 nM and 15 μM, respectively.

