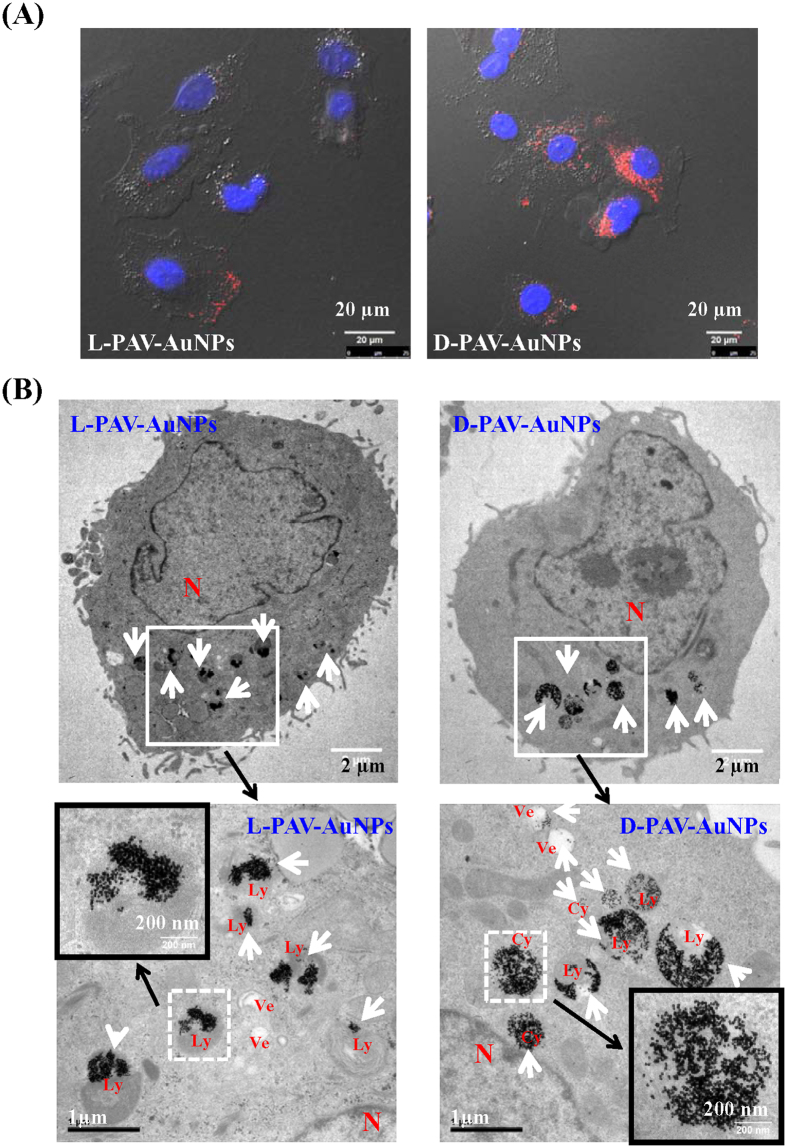
Figure 7. The distribution of NPs in A549 cells.
(A) CLSM images of A549 cells treated with (Left image) L-PAV-AuNPs and (Right image) D-PAV-AuNPs for 24 h. Merged images of nucleus staining and bright field. (B) Representative TEM micrographs of sectioned A549 cells after being cultured with (Left images) L-PAV-AuNPs and (Right images) D-PAV-AuNPs at an Au concentration of 50 μg·mL−1, showing subcellular localization of the internalized NPs, respectively. The white arrow heads indicate the PAV-AuNPs, and the black arrows indicate the amplification regions. N: Nucleus; Ly: Lysosome; Ve: Vesicle; Cy: Cytosol.

