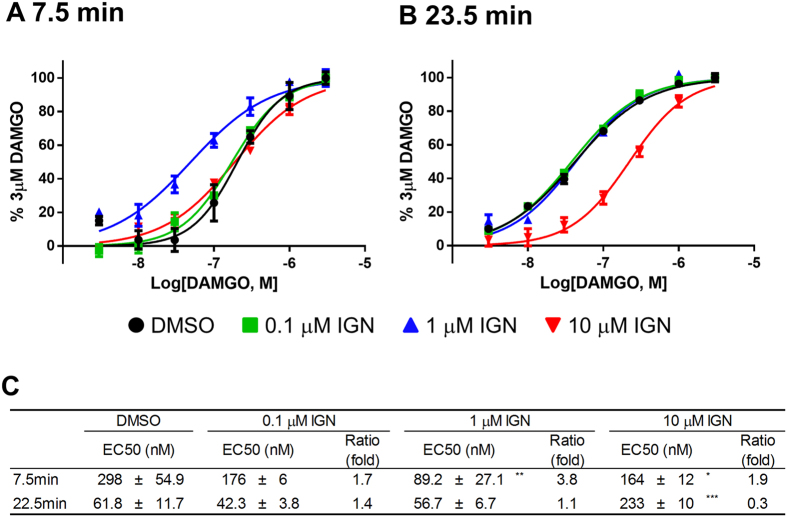
Figure 5. Dose-response curve in intracellular cAMP assays.
(A,B) Activation curves show representative data from three independent experiments. In the early phase (7.5 min after forskolin administration), ignavine shifted the activation curve of DAMGO to the left, which indicated that ignavine worked as an MOR enhancer (A). In contrast, in the late phase (23.5 min after forskolin administration), ignavine shifted the activation curve to the right, which indicated that ignavine acted as an MOR inhibitor (B). EC50 values of DAMGO and Ratio (fold-change of EC50) are shown in (C). Data shown represent the mean +/− SEM (n = 3). *P < 0.05; **P < 0.01; ***P < 0.001 by Dunnett’s test vs. DMSO.

