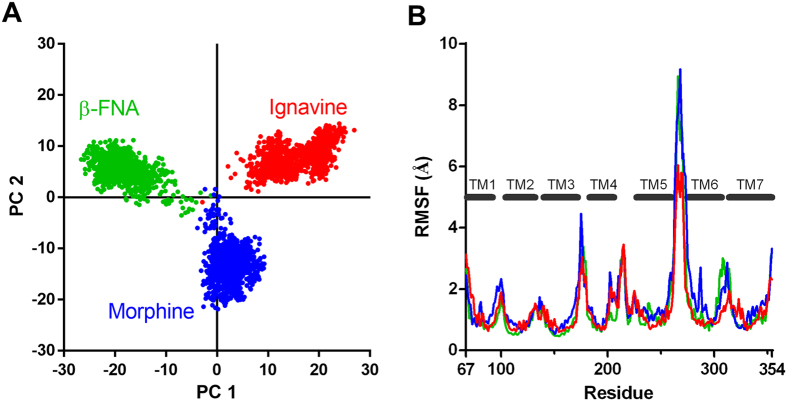
Figure 8. Molecular dynamics simulation of the ignavine–human MOR complex.
(A) Two-dimensional principal component analysis (PCA) projections of trajectories obtained from MD simulations. (B) Root mean square fluctuations (RMSF) of each amino acid residue in the human MOR molecule during MD simulation. Data of ignavine, morphine and β-FNA are represented in red, blue and green, respectively.

