
Figure 5.
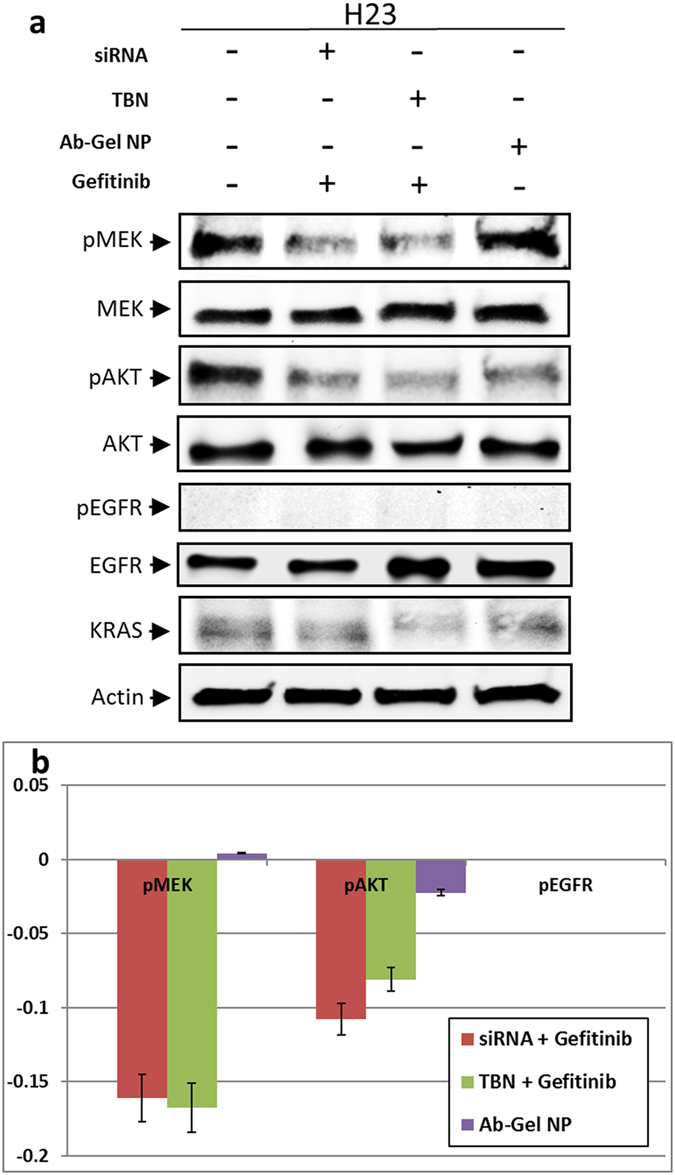
(a) Western Blot analysis showing the effect of KRAS mutant knockdown by transfection agent or through TBN and gefitinib on the phosphorylation of MEK, AKT, EGFR in the KRAS mutation positive NSCLC cell line; (b) A graphical representation using densitometry image analysis, showing the protein expression levels after KRAS knockdown. The data were obtained from three independent experiments.