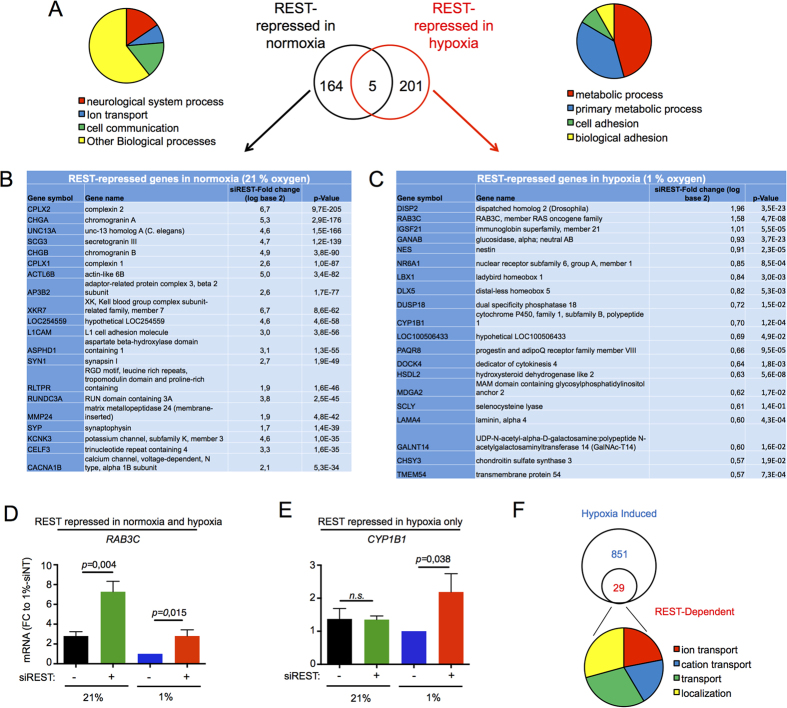
Figure 4. REST regulates different transcriptional networks in normoxia and hypoxia.
(A) There is limited overlap (5 genes) between REST-Dependent genes repressed in normoxia (164, dark circle) and REST-Dependent genes repressed in hypoxia (201, red circle). Circular diagrams show the distribution of enriched GO biological processes by PANTHER overrepresentation test. Significance was set at p < 0.05. The top 20 genes by fold-change upon REST-RNAi treatment for the REST-Dependent genes repressed in normoxia (B) and REST-dependent genes repressed in hypoxia (C) are shown. (D,E) qRT-PCR was used to validate the mRNA expression of the REST target genes RAB3C and CYP1B1 in cells exposed for 24 hours to normoxia (21% oxygen) or hypoxia (1% oxygen), in the presence or absence of an siRNA targeting REST. (F) Of the 851 genes induced in hypoxia (blue circle), 29 were further induced by REST siRNA treatment. Circular diagrams show the distribution of enriched GO biological processes by PANTHER overrepresentation test.

