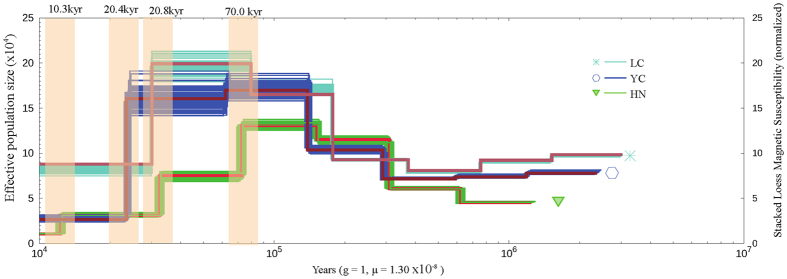
Figure 4. Effective population size changes of Musa itinerans over time using the Pairwise Sequentially Markovian Coalescent (PSMC) model.
Using a generation time (g) of one year per generation, and a mutation rate of 1.30 × 10⁻⁸ substitutions per generation, the PSMC results were scaled to real time. Three different geographic populations were marked by distinctive color curves, and the most drastic population size change was shadowed. As shown, the effective population sizes of the two continental populations (YC, LC) were downsized in closely approximate epoch, and more recent than the island population (HN).

