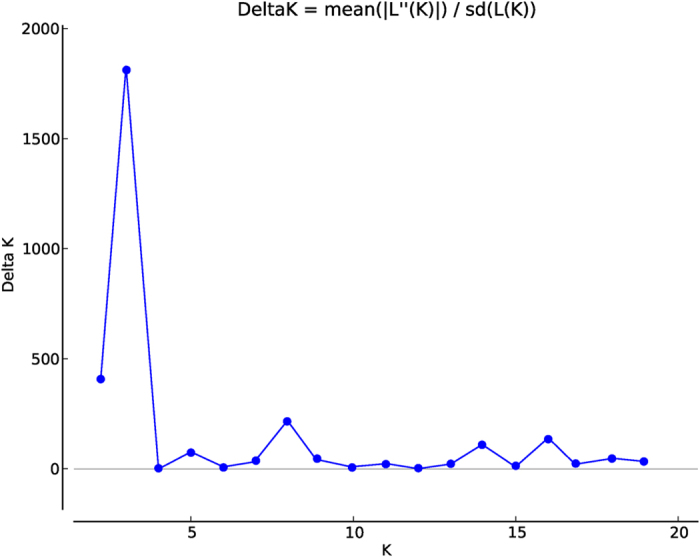
Figure 1. Delta K values for STRUCTURE analysis of Chinese jujube accessions.

Delta K, calculated according to Evanno et al. 51, is plotted against the number of modeled gene pools (K).

Delta K, calculated according to Evanno et al. 51, is plotted against the number of modeled gene pools (K).