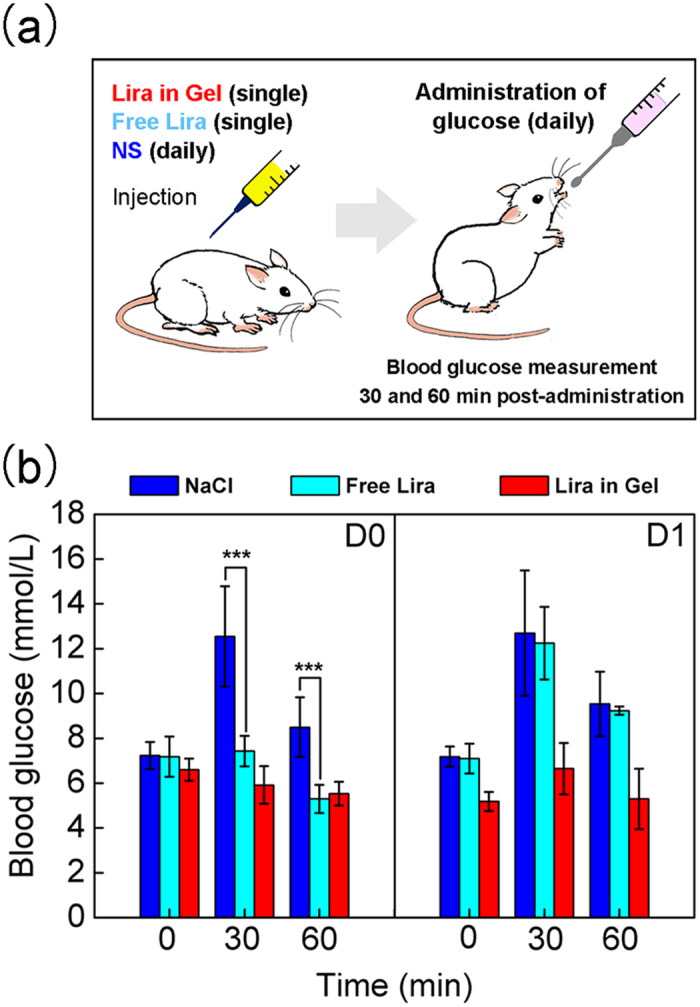
Figure 6. OGTT of ICR mice.

(a) Schematic illustration of the procedure of the OGTT. To mimic the postprandial state, the mice were poured by glucose (3 g/10 mL/kg) once daily. Blood samples were collected at t = 0, 30 and 60 min for glucose measurements before and after the oral gavage of glucose. The data of blood glucose at t = 0 reflects the limosis blood glucose level before the oral gavage of glucose, while the data of blood glucose at t = 30 and 60 min after the oral gavage of glucose indicate the postprandial blood glucose levels. (b) Blood glucose levels in ICR mice in the groups “NaCl” (injection of 0.9% NS daily) “Free Lira” (a single injection of Lira solution) and “Lira in Gel” (a single injection of the Lira-loaded PCGA-PEG-PCGA gel formulation), n = 6 for each group. Here, the normal coordinate indicates the time after oral administration of glucose. “D0” in the legend denotes the day of injection, “D1” indicates the next day after the treatment. The significant differences between the group of “NaCl” and that of “Free Lira” are specifically marked: ***p < 0.001.
