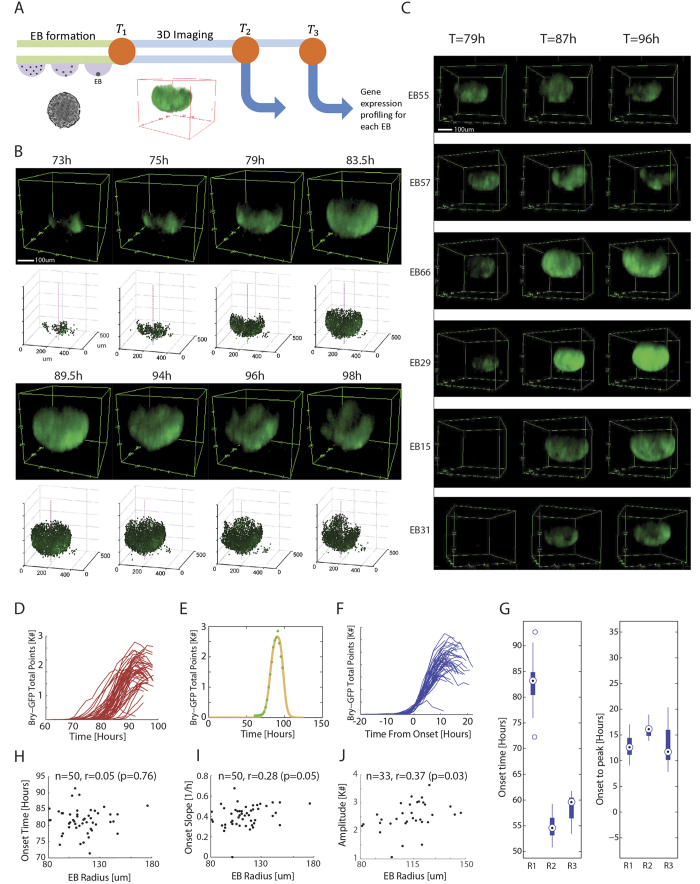
Figure 1. Brachyury-GFP progresses in a prototypical spatio-temporal pattern with high onset variability in EBs.
(A) Experimental approach flow schematics. Brachyury-GFP EBs are live-imaged over 2–3 days, then individually collected for expression profiling at a selected time point. (B) Progression of Brachyury-GFP expression in an EB undergoing non-directed differentiation, with its corresponding segmentation data. (C) 3D visualization of six EBs at three different time points, demonstrating Bry-GFP onset variability. (D) Total number of Bry-GFP points as a function of time for 51 EBs imaged in one experiment. Bry-GFP onset shows a spread of >20 hours. (E) A simple impulse model describing Bry-GFP dynamics (yellow line) fit to data from a single EB (green). (F) The dynamic profiles of the EBs shown in (d) aligned by their onset time, defined by the impulse model. (G) Distributions of Bry-GFP onset and onset to peak time for three different experiments (onset: n = 50, 10, 12, onset to peak: n = 15, 10, 12 since not all EBs from repeat 1 reached peak expression). (H–J) Bry-GFP onset time (H), onset slope (I) or amplitude (J) plotted against EB radius prior to onset, showing no significant correlation in any of the three parameters.

