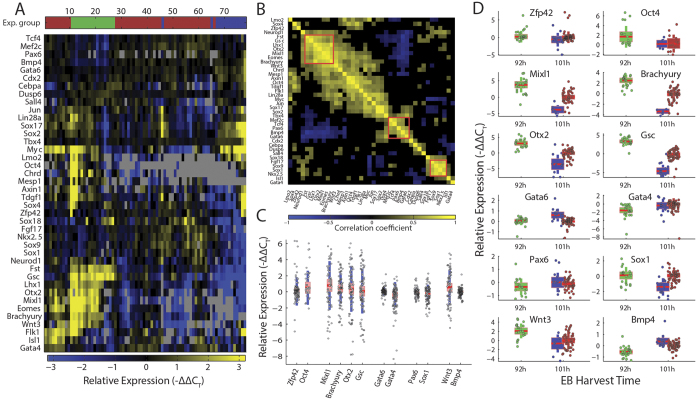
Figure 2. EB gene expression shows functional clusters and a wide spread.
(A) Clustered expression of 40 genes in 78 EBs from 3 separate experiments, sampled at either 92 hours (n = 23, green) or 101 hours (n = 52, red; n = 15, blue) into differentiation. Each column represents one EB. (B) Correlation matrix of the 40 gene expression profiles in (a); Absolute correlation values below 0.3 are blacked out. A primitive-streak gene cluster, and two later phase ectoderm/mesoderm gene clusters are marked by red squares. (C) Expression levels of 12 genes across the measured EBs, showing ranges between 2 and 10 CT values. (D) Expression levels of the same genes grouped by experiment.

