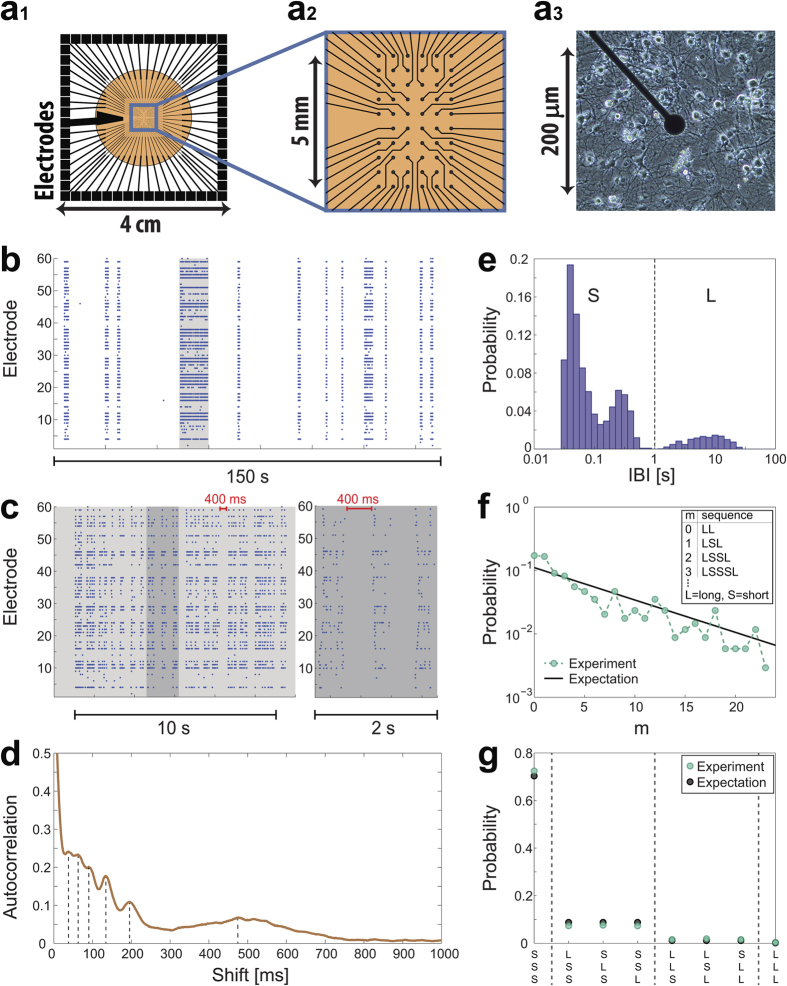
Figure 1. Bursts of spontaneous activity in neural cultures.
(a1) A micro-electrode array (MEA), the orange circle with diameter of ~2.2 cm represents the tissue culture area of ~1.3 million cortical neurons (Methods). (a2) Zoom in on the blue square in a1 showing the arrangement of the 60 electrodes separated by 500 μm. (a3) Zoom in on one electrode, showing neurons and connections. (b) A raster plot of the network’s spontaneous activity, recorded by the 60 electrodes over 150 seconds out of 60 minutes. (c) Zoom in of 10 seconds of the gray area in b (left) and 2 seconds out of the 10 seconds (right). The ~400 ms represents a short inter-burst-interval (IBI) (Methods). (d) Autocorrelation of the rate of the entire recording in b. (e) A normalized histogram of the IBIs presented in log scale (Methods), a multimodal distribution is observed. Short/long IBIs are denoted by S/L, respectively. (f) A log-linear plot of the probability for m consecutive short IBIs bounded by long IBIs as a function of m (green circles), and the geometric distribution P = PL·PSm (gray line) assuming independent events with probabilities PS and PL = 1 − PS for S and L IBIs, respectively. (g) The eight measured probabilities (green circles) for three consecutive IBIs, where S/L stand for short/long IBIs, and the compared probabilities assuming independent events taken from PS and PL (gray circles).

